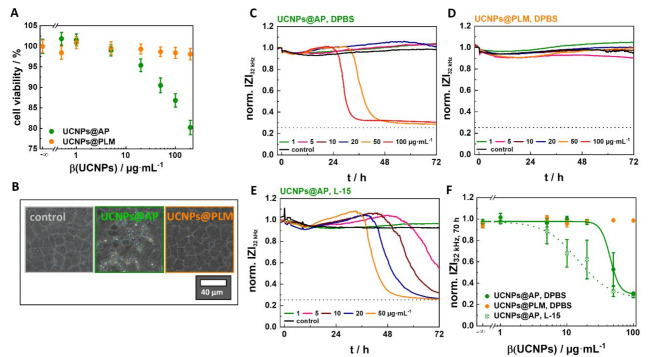
Fig. 2.
(A) Cell viability of NRK cells incubated with 12 nm UCNPS@AP or UCNPs@PLM (mass concentrations (β) of 0.5–200 µg·mL−1, L-15, 5% FCS) for 24 h as determined by PrestoBlue assays and (B) corresponding phase contrast micrographs (100 µg·mL−1). Representative time courses of impedance at 32 kHz of NRK cells, exposed to 33 nm (C) UCNPS@AP in DPBS (5% FCS), (D) UCNPs@PLM in DPBS (5% FCS), and (E) UCNPS@AP in L-15 (5% FCS). Impedances were normalized to the initial value measured at 0 h. The baseline magnitude of impedance was (1.080 ± 0.007) kΩ before particle addition. The dashed line represents the impedance value of a cell-free electrode. (F) Concentration-response relationship of the normalized impedance after exposing NRK cells for 70 h to 33 nm UCNPs. EC50 values were calculated from the data of three measurements using a 4-parameter logistic model: EC50(UCNPs@AP, DPBS, 70 h) = (45 ± 7) µg·mL−1 (adjusted R2 = 0.999) and EC50(UCNPs@AP, L-15, 70 h) = (15 ± 2) µg·mL−1 (adjusted R2 = 0.999).

