Fig. 4.
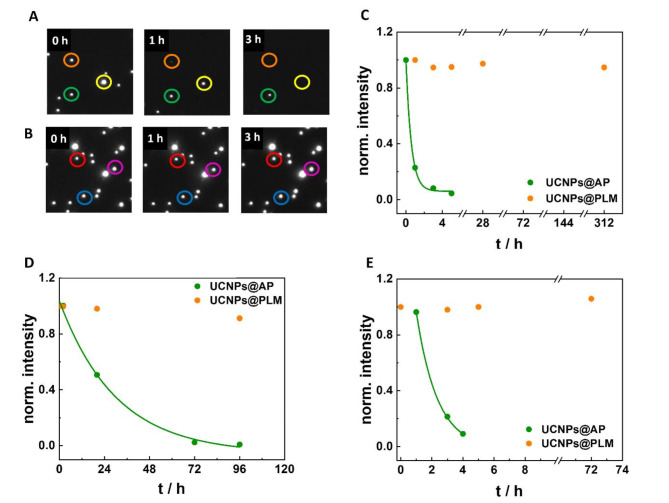
Representative wide-field upconversion micrographs (10 × 10 μm) of 33 nm (A) UCNPs@AP and (B) UCNPs@PLM in H2O at rt at 0 h, 1 h and 3 h upon 974 nm excitation (8 kW·cm−2). (C) Normalized intensity of UCNPs@AP and UCNPs@PLM in H2O at rt for 13 d, (D) in H2O at rt for 6 d after 30 min pre-incubation with FCS (5%, DPBS) and (E) in H2O at 37 °C for 3 d after 30 min pre-incubation with FCS (5%, DPBS) with exponential decay fit for UCNPs@AP to estimate dissolution half-lives (t1/2). C) Experiments were conducted twice. The weighted average of t1/2 = (0.41 ± 0.02) h. D) Experiments were conducted twice. The weighted average of t1/2 = (0.5 ± 0.1) d. E) Experiment was conducted just once with t1/2= (1.3 ± 0.1) h. The uncertainty corresponds to the uncertainty of the fit. The raw data points correspond to the luminescence intensity of single UCNPs averaged over 100 ROIs covering a total surface of 0.16 mm2 (typically N = 760 (H2O) – 3600 (protein corona) spots).

