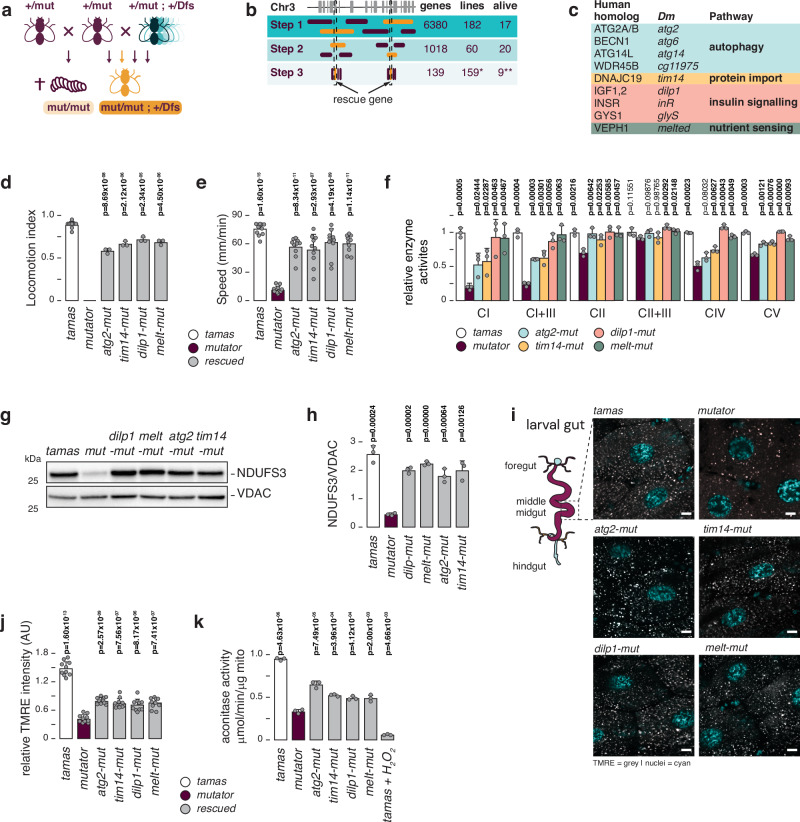
Fig. 1. A genetic deficiency screen in mtDNA mutator flies.
a Cartoon depicting the genetic screen strategy. Male heterozygous POLγexo- ( + /mut) flies are crossed to a library of heterozygous deficiency strains (Dfs). Resulting double heterozygous (+/POLγexo-; +/Dfs) females are then selected for crosses with fresh heterozygous POLγexo- ( + /mut) males to screen for viable homozygous POLγexo- (mut/mut; +/Dfs) adult flies. b Deficiency strains were used in steps 1 and 2, followed by testing individual genes, using mutant and P-element insertion mutant fly lines (step 3). The number of genes tested (genes), number of fly strains (lines) used, and number of rescued lines (alive) are shown. c The identified mitorescue genes are shown, as well as their human homologs, and biological pathways. d Negative geotaxis test (NGT), measuring fly locomotion of tamas control (white), mutator (plum), and rescued (grey) flies 2 days after eclosure. Mean values of number of flies tested are shown. N = 3 biological replicates with 10 flies per replica. For tamas controls N = 10 biological replicates with 10 flies per replicates. e Crawling distance of third instar larvae from tamas control (white), mutator (plum), and rescued (grey) flies. Mean values of distance crawled per minute are shown. N = 10 biological replicates per genotype. f Relative mitochondrial respiratory chain enzyme activities in isolated mitochondria from third instar larvae. Measurements were performed for NADH:ubiquinone oxidoreductase (CI), NADH:cytochrome c oxidoreductase (CI + III), succinate:ubiquinone oxidoreductase (CII), succinate:cytochrome c oxidoreductase (CII + III), cytochrome c oxidase (CIV), and ATP synthase (CV). Tamas controls are shown in white, mutator in plum, atg2-mut in blue, tim14-mut in yellow, dilp1-mut in pink, and melted-mut in green. Mean values relative to tamas are shown. N = 3 biologically independent samples per genotype. g Western blot analysis of protein extracts from third instar larvae, decorated with antibodies against the OXPHOS complex I subunit NDUFS3, and VDAC. h Quantification of (g). Men values of NDUFS3 relative to loading control (VDAC) are shown. Tamas controls are shown in white, mutator in plum, and rescued larvae in grey. N = 3 biological replica. i Representative images of TMRE staining (grey) of gut tissue from third instar larvae. Nuclei are stained with Hoechst (cyan). Scale bar = 9 μm. j Quantification of (i). Mean values of percentage of relative image intensity are shown. N = 10 images per genotype. Tamas controls are shown in white, mutator in plum, and rescued larvae in grey. k Aconitase activities in fresh mitochondria of third instar larvae. Mean values per μg of mitochondria are shown. Tamas controls are shown in white, mutator in plum, and rescued larvae in grey. N = 3 biologically independent samples per genotype. Student’s two-tailed T-test was used with mutators (mut) against other genotypes, except for (d) where values were compared to tamas. P values < 0.05 are shown in bold. Error bars represent Standard deviation. Source data are provided in the main figure source data file.

