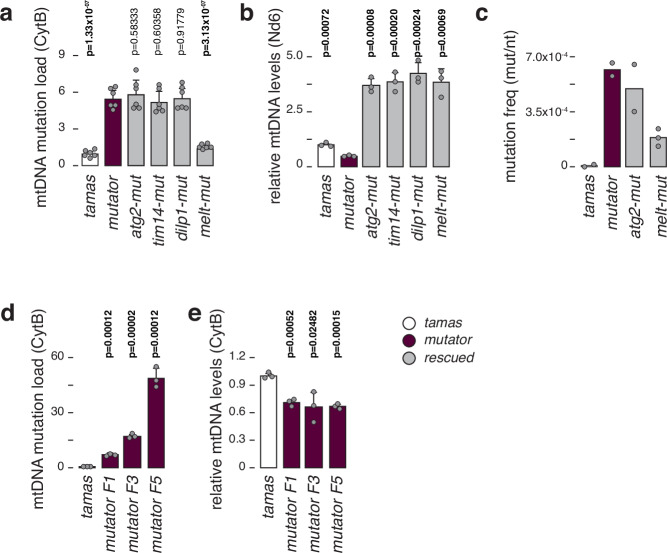
Fig. 2. mtDNA mutation load in mtDNA mutator and rescued flies.
a Relative mtDNA mutation load in third instar larvae, determined by random mutation capture assay (RMC). Mean values relative to tamas are shown. N = 6 biologically independent samples with 10 flies each per genotype and 3 technical replicates. b Relative mtDNA levels in third instar larvae, using ND6 as mtDNA and rp49 as nuclear targets. Mean values relative to tamas are shown. N = 3 biologically independent samples with 3 technical replicates for each genotype. c mtDNA mutation frequency determined by cloning and sequencing. Mean values per nucleotide sequenced are shown. For tamas, mutator, and atg2-mutator samples N = 2 biologically independent samples, with at least 180 clones sequenced per genotype were used. For melt-mutator N = 3 independent biological replicates were used. d Relative mtDNA mutation load in third instar larvae, determined by random mutation capture assay (RMC). Mean values relative to tamas are shown. N = 3 biologically independent samples with 10 flies each per genotype and 3 technical replicates. e Relative mtDNA levels in third instar larvae, using Cytb as mtDNA and rp49 as nuclear targets. Mean values relative to tamas are shown. N = 3 biologically independent samples with 3 technical replicates for each genotype. Tamas controls are shown in white, mutator in plum, and rescued larvae in grey. Student’s two-tailed T-test was used with mutators (mut) against other genotypes. P values < 0.05 are shown in bold. Error bars represent Standard deviation. Source data are provided in the main figure source data file.

