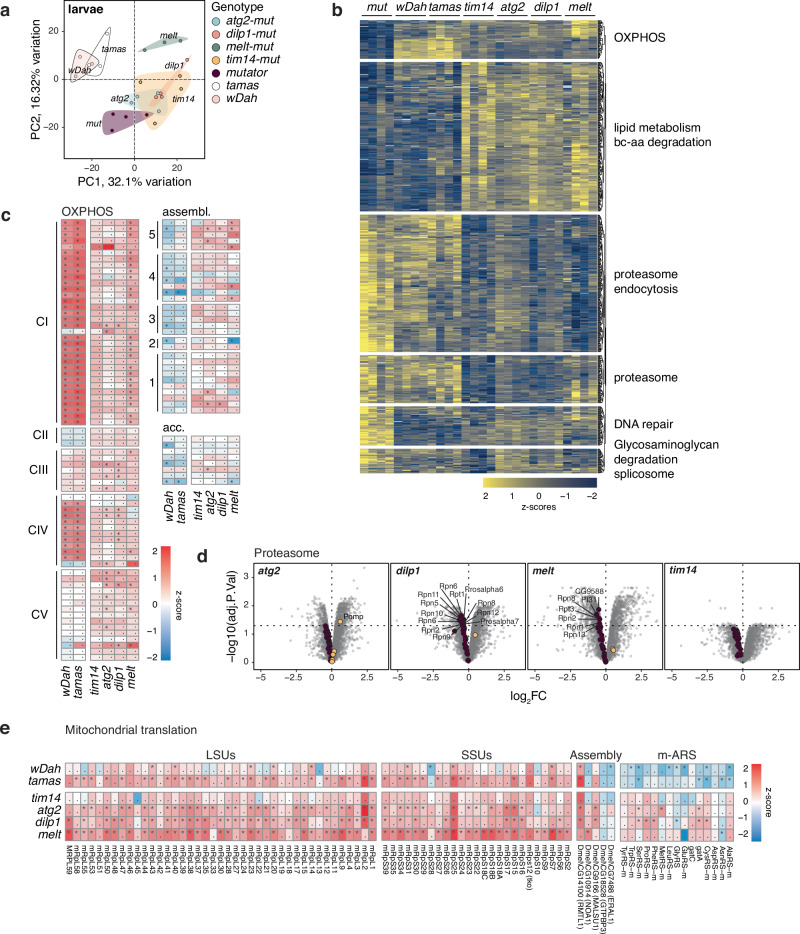
Fig. 3. Normalisation of the fly larvae proteome upon rescue.
a Principal components 1 and 2 of larval proteomes. Each dot is one sample. Colour overlay groups genotypes. b Expression of significantly different proteins (ANOVA, FDR < 0.01) as z-scores. Functional categories are significantly enriched gene ontologies (Fisher’s exact test, FDR < 0.05). Each column is one replicate. c LogFC of OXPHOS, assembly and accessory subunits relative to mutator larvae and pooled by genotype (n = 4). d Volcano plots of respective genotypes against mutator larvae proteomes with the proteasome category highlighted. e LogFC of proteins involved in mitochondrial translation relative to mutator larvae and pooled by genotype (n = 4). * indicates significant hits (multiple-testing adjusted p-values, FDR < 0.05).

