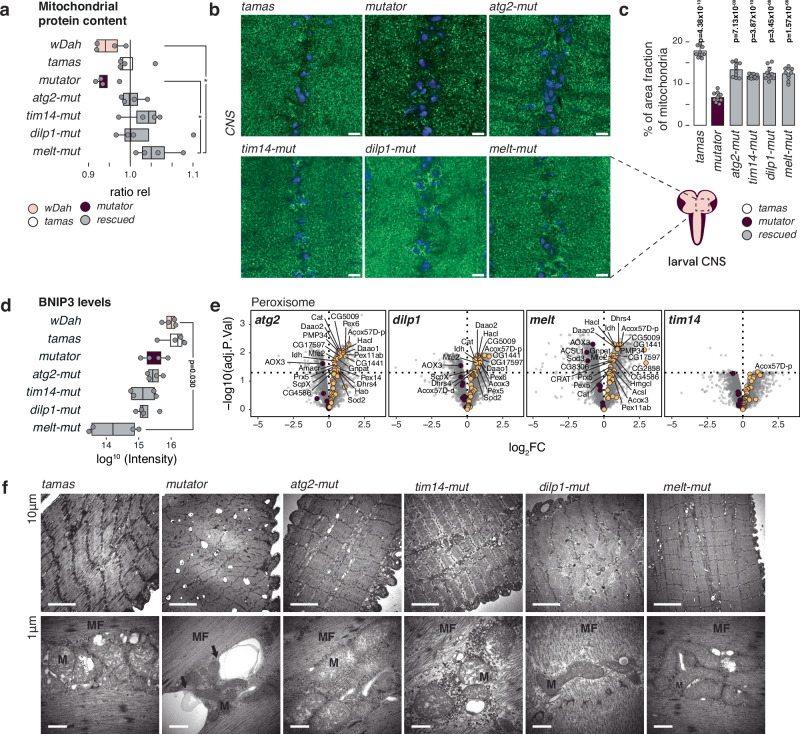
Fig. 4. Reduced mitochondrial mass in mtDNA mutator larvae.
a Relative abundance of the mitochondrial proteome normalised to the summed mean protein intensities in tamas. Data is presented as the larvae intensity ratio of mitochondrial proteins relative to tamas (ratio rel). wDah (pink), tamas (white) controls, mutator (plum), and rescued (grey) larvae are shown. N = 4 independent biological replicates. Boxplots represent the first and third quartile with median indicated. Whiskers represent the ±1.5 interquartile range. b Confocal images of the larval ventral nerve chord showing mitochondria in green (α-ATP-synthase) and nucleus in blue (DAPI). (Scale bar = 6 µm; Zoom = 1.8X). c Quantification of (b) with tamas (white) controls, mutator (plum), and rescued larvae (grey). Mean percentage of area fraction of mitochondria analysed. The average of ten independent images per genotype is shown. Student’s two-tailed T-test was used with mutators (mut) against other genotypes. P values < 0.05 are shown in bold. Error bars represent Standard deviation. N = 10 biological replicates per genotype. d Abundance of BNIP3 related peptides is shown for the genotypes as indicated. N = 4 independent biological replicates. Boxplots represent the first and third quartile with median indicated. Whiskers represent the ±1.5 interquartile range. wDah (pink), tamas (white) controls, mutator (plum), and rescued (grey) larvae are shown. e Volcano plots of respective genotypes against mutator larvae proteomes with the peroxisome category highlighted in plum (down) and yellow (up). Only rescued samples are shown. Control samples are shown in the supplementary files. f Transmission electron microscopy sections of third-instar larvae muscle. Top panels: section showing double membrane vesicular structures evocating autophagy figures in mutator larvae. These structures sometimes contact (mutator, arrows), or contain mitochondria (mutator, arrows). Bottom panels: higher magnification views. (arrows = autophagy like vesicle, M=mitochondria, MF= muscle fibre). Representative images from N = 3 biological replicates (20 images per replicate) are shown.

