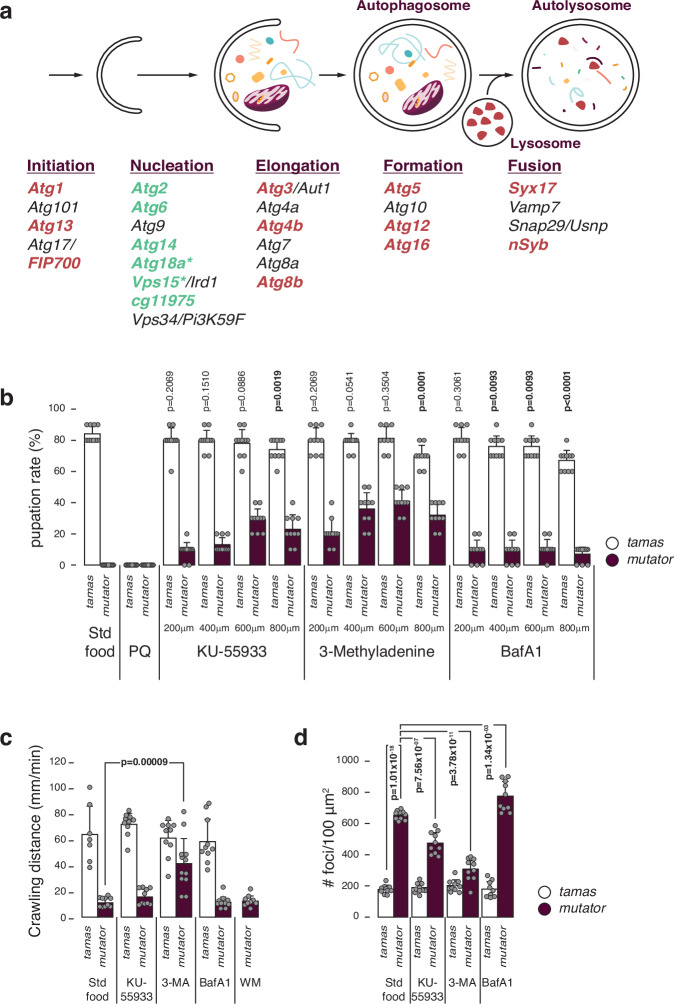
Fig. 6. Increased macroautophagy in mtDNA mutator larvae.
a Simplified scheme of the Drosophila autophagy pathway. Steps and involved genes are shown. Tested genes are coloured (red and green), with only green genes that rescued the mutator larva lethality. b Pupation rates after growing control and homozygous POLγexo- larvae in the presence of inhibitors specific to autophagy initiation (KU-55933), nucleation (3-methyladenine (3-MA)), or autolysosome formation (BafA1) at 3 different concentrations. PBS was used as control. Mean values of hatched flies from number of embryos seeded are shown. N = 10 biologically independent samples with 10 embryos/sample. c Crawling distance of third instar larvae grown in the presence of KU-55933, 3-MA and BafA1. Mean values of crawling distance in mm/min are shown. N = 10 biological replicates per genotype, except for tamas on standard food (N = 7), mutator on 3-MA (N = 12) and mutator on wortmannin (WM) (N = 9). d Quantification of lysosomal foci after LysoTracker and Hoechst staining in midgut cells from control and homozygous POLγexo- larvae grown in the presence of KU-55933, 3-MA and BafA1, showing the mean number of lysotracker foci per 100 μm2. N = 10 independent biological replicates per genotype, except for tamas on BafA1 (N = 9). Tamas controls in white and mutator in plum. Student’s two-tailed T-test was performed in comparison to tamas (standard food) for (b) and mutator (mut) (standard food) for (c) and (d). P values < 0.05 are shown in bold. Error bars represent Standard deviation. Source data are provided in the main figure source data file.

