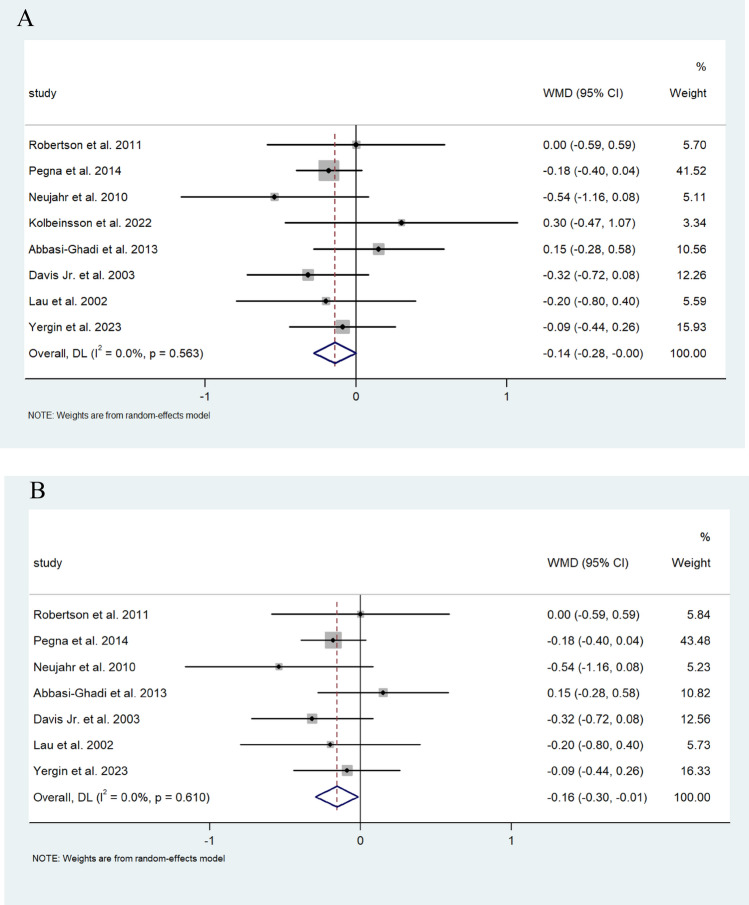
Fig. 2.
A Forest plot demonstrating the mean weighted difference (MWD) in FEV1 (L/s) in patients after lung transplant undergoing ARS. Effect size is plotted to permit comparison of studies reporting FEV1 values before and after ARS. B Forest plot demonstrating the MWD in FEV1 (L/s) in patients after lung transplant undergoing fundoplication. Effect size is plotted to permit comparison of studies reporting FEV1 values before and after fundoplication

