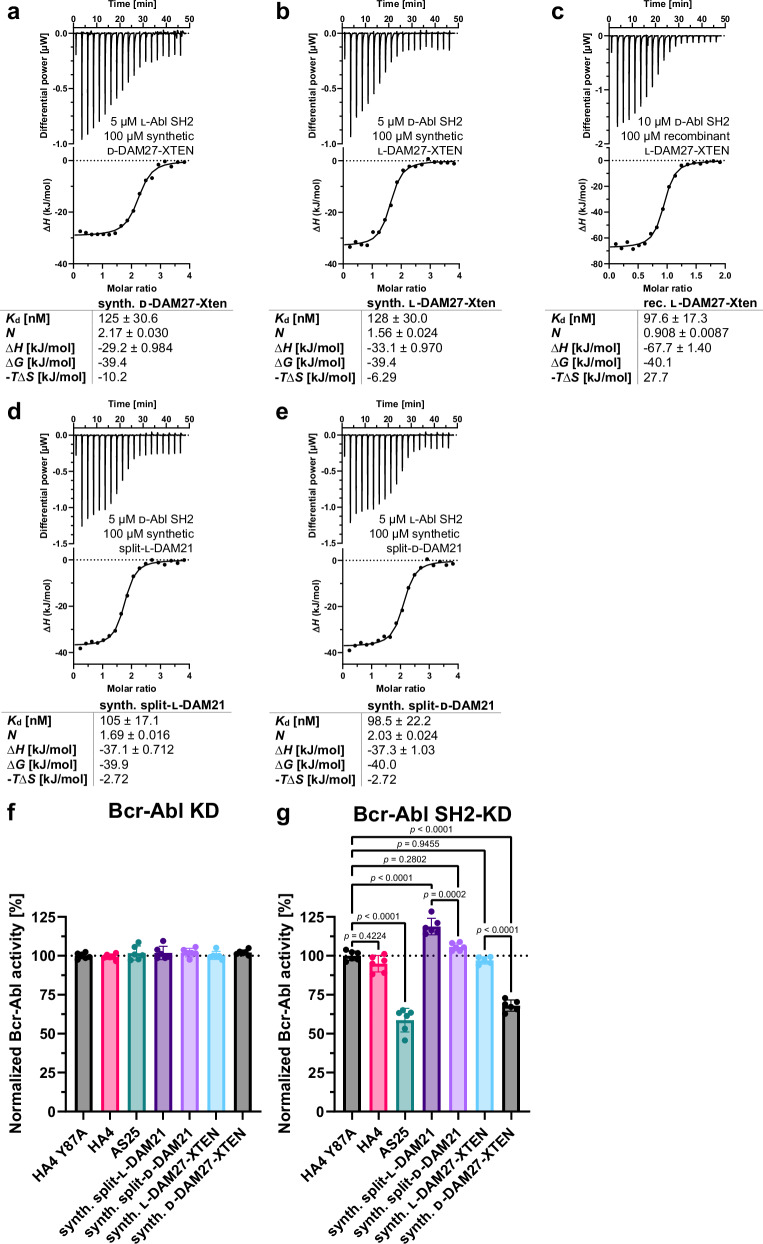
Fig. 8. Binding of synthetic l- and d-monobodies to d- and l-Bcr-Abl SH2.
a–e Isothermal titration calorimetry (ITC) measurements of (a) synthetic d-DAM27-XTEN titrated to recombinantly expressed l-Abl SH2, (b) synthetic l-DAM27-XTEN and (c) recombinant l-DAM27-XTEN both titrated to synthetic d-Abl SH2, (d) synthetic split-l-DAM21 and (e) synthetic split-d-DAM21 titrated to synthetic d- and l-Abl SH2, respectively. Each panel shows the raw heat signal of an ITC experiment (top) and the integrated calorimetric data of the area of each peak (bottom). The continuous line represents the best fit of the data based on a 1:1 binding model computed from the MicroCal software. Binding parameters including Kd value, stoichiometry (N), enthalpy (∆H), free enthalpy (∆G) and −T∆S calculated from the fit of each experiment are shown below. A representative measurement of at least two ITC experiments for each monobody is shown. f, g Measurement of kinase activity of (f) Bcr-Abl kinase domain (KD) and (g) SH2-KD after incubation with synthetic split-l- and d-DAM21 as well as synthetic l- and d-DAM27-XTEN in comparison with binding control monobodies HA4 and AS25 and the non-binding control monobody HA4 Y87A using a radiometric kinase assay. All monobodies were used at a concentration of 5 µM. Here, radioactively labeled 32P was incorporated into a biotinylated substrate peptide by recombinantly expressed KD and SH2-KD and detected via scintillation counting. Six independent experiments were performed (depicted as dots) and averaged. Error bars represent the standard deviation (SD) and statistical analysis was done with a one-way ANOVA and Sidak’s test. The calculated p-values are depicted in (g) and were considered statistically significant below a value of 0.05. F values and degrees of freedom were 124.3 and 40. Source data of (f, g) are provided as a Source Data file.

