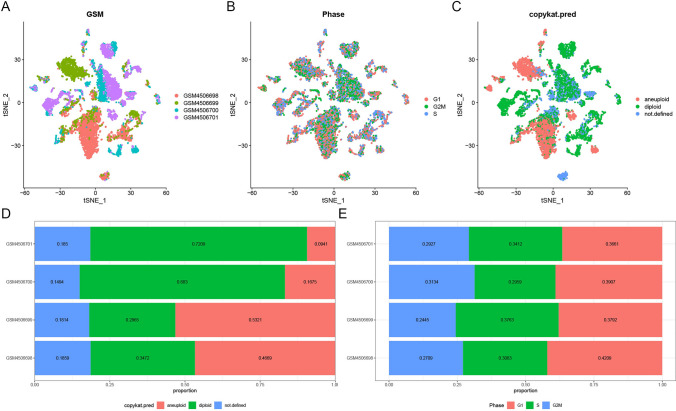
Fig. 1.
Single-cell RNA sequencing (scRNA-seq) analysis of lung adenocarcinoma (LUAD) samples. A t-SNE plot showing sample type distribution across four datasets: GSM4506698, GSM4506699, GSM4506700, and GSM4506701. Each color represents a different dataset, highlighting distinct clustering. B t-SNE plot illustrating cell cycle phase distribution (G1, G2M, and S) within the samples. C t-SNE plot displaying cell ploidy status, categorized as aneuploid, diploid, or undefined. D Bar plot of cell type proportions in each dataset, revealing a predominance of diploid cells in GSM4506700 and GSM4506701 and a higher proportion of aneuploid cells in GSM4506698 and GSM4506699. E Bar plot depicting cell cycle phase distribution (G1, G2M, S) across datasets, showing balanced proportions

