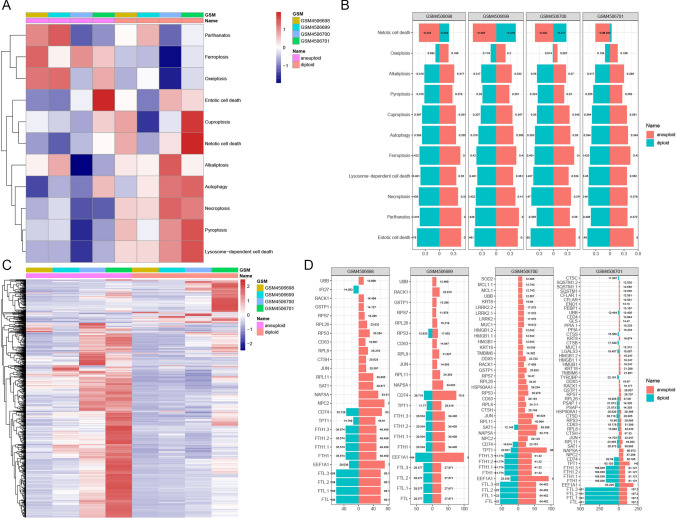
Fig. 2.
Programmed cell death (PCD) pathway enrichment in LUAD cells. A Heatmap of PCD pathway activation in malignant versus non-malignant cells across datasets, highlighting distinct activation profiles in pathways like parthanatos, ferroptosis, and oxeiptosis. B Bar plot showing activation scores for key PCD pathways in aneuploid and diploid cells within each dataset. Aneuploid cells in GSM4506701 exhibit notable enrichment in netotic cell death pathways, while diploid cells show higher activation in cuproptosis and pyroptosis pathways. C Heatmap of PCD-related gene expression across aneuploid and diploid cells, revealing differential profiles by cell type. D Bar plots showing PCD-related gene expression, with genes such as NPC2, NAPSA, and SAT1 elevated in aneuploid cells and FTL, FTL1, and FTL2 elevated in diploid cells

