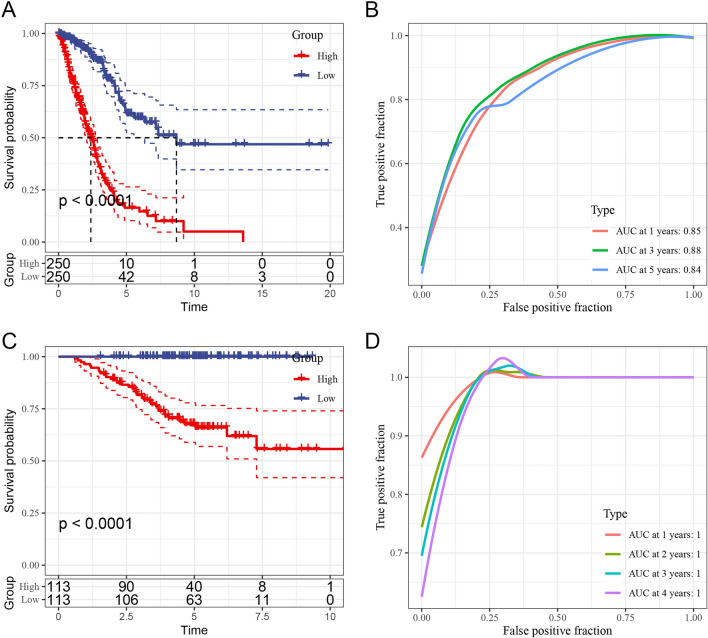
Fig. 8.
Prognostic analysis of PCD-related subtypes in TCGA and GSE31210 datasets. A Kaplan–Meier survival curves for high- and low-risk groups in TCGA dataset, with the low-risk group showing better prognosis (p < 0.0001). B ROC curve for TCGA dataset, with AUC values of 0.85, 0.88, and 0.84 at 1, 3, and 5 years, demonstrating strong predictive performance. C Kaplan–Meier survival curves for GSE31210 dataset, reaffirming significant survival differences between risk groups. D ROC curve for GSE31210, supporting the model’s prognostic accuracy with high AUC values

