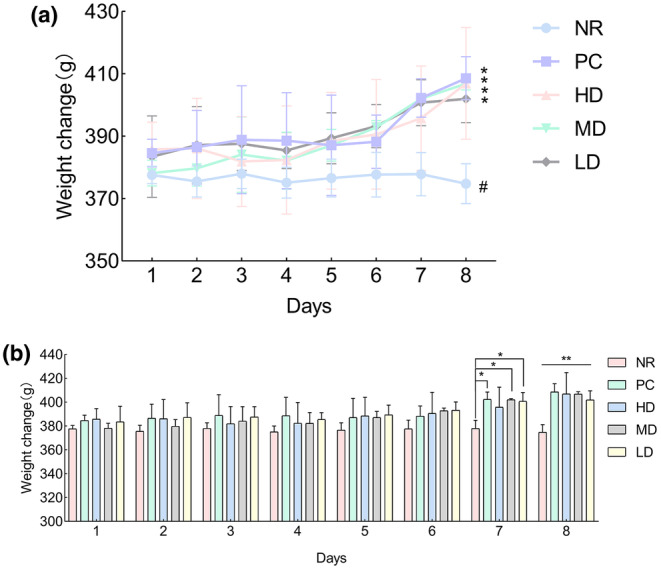
FIGURE 4.

General physical changes: (a) It is a trend chart of weight change. In (a), * indicates an upward trend, and # indicates a downward trend. (b) It is a weight change chart. In (b), * represents a significant difference compared to the natural recovery group. Where * indicates a significant difference compared with NR (p < .05), ** indicates a significant difference compared with NR (p < .01).
