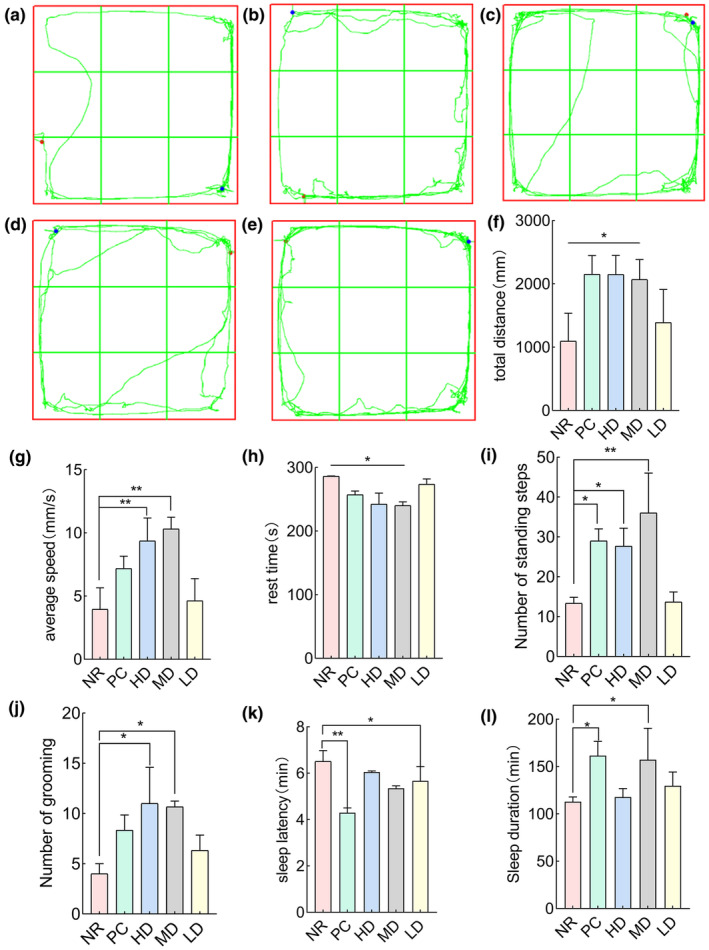
FIGURE 5.

Behavioral experiments: (a) NR, (b) PC, (c) HD, (d) MD, and (e) LD. (f) The total water distance, (g) the average velocity, (h) the resting time, (i) the number of standing times, and (j) the number of grooming times. (k) Rat sleep latency and (l) rat sleep time. Where * indicates a significant difference compared to the natural recovery group (p < .05), and ** indicates a significant difference compared to the natural recovery group (p < .01).
