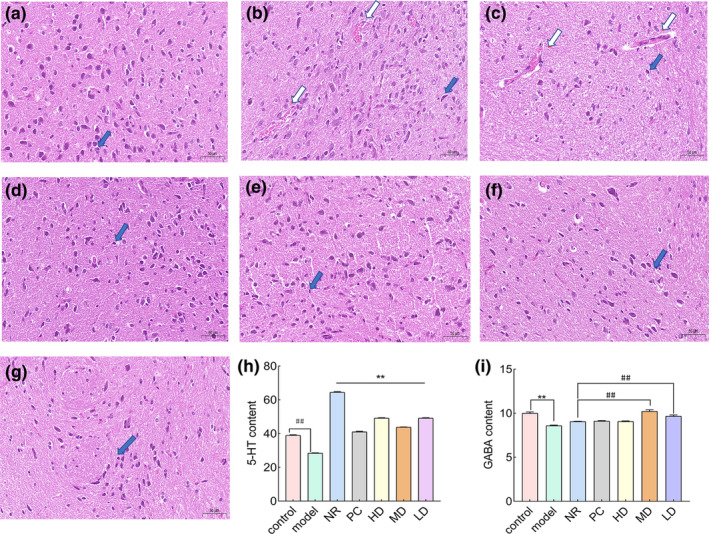
FIGURE 6.

HE staining (40×), tissue testing, and blood biochemical test results: (a) the control group, (b) the model group, (c) NR, (d) PC, (e) HD, (f) MD, and (g) LD. Blue arrows were hyperchromatic for nerve cell pyknotic nuclei and white arrows were small focal hemorrhages. (h) The 5‐HT content of the control group versus the model group expressed by ##, where ## indicated a significant difference (p < .01*) compared with the control group. The 5‐HT content of the positive control group versus the three concentration groups with natural recovery is indicated by **, where ** indicates a significant difference (p < .01*) compared with the natural recovery group. (i) The GABA content of the control group versus the model group indicated by **, where ** indicates a significant difference (p < .01#). The GABA content of the positive control group versus the three concentration groups with natural recovery was expressed by ##, where ## indicates a significant difference (p < .01).
