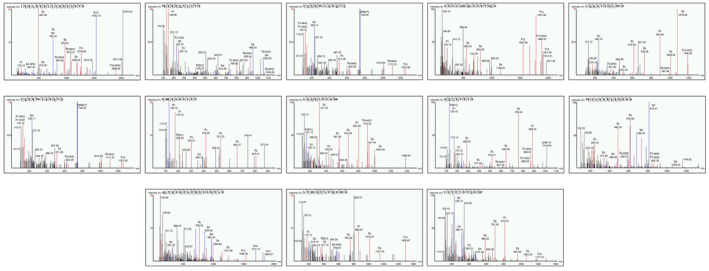
FIGURE 1.

Liquid chromatography–mass spectrometry (LC–MS) analysis of conch peptides hydrolysate. The figure represents the results of LC–MS analysis conducted on conch peptides hydrolysate. Thirteen distinct spectra were observed, representing different peptides with diverse amino acid compositions and lengths published previously (Ullah et al., 2023).
