FIGURE 2.

The FTIR spectra of the crude sample and peptide hydrolysate were analyzed, revealing distinct peak appearances: (a) FTIR spectrum of the crude sample and (b) FTIR spectrum of the CPH sample.

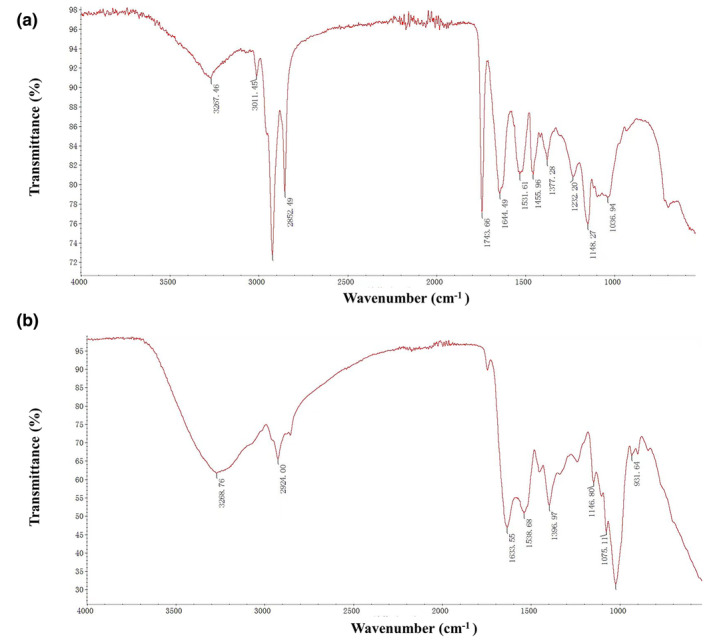
The FTIR spectra of the crude sample and peptide hydrolysate were analyzed, revealing distinct peak appearances: (a) FTIR spectrum of the crude sample and (b) FTIR spectrum of the CPH sample.