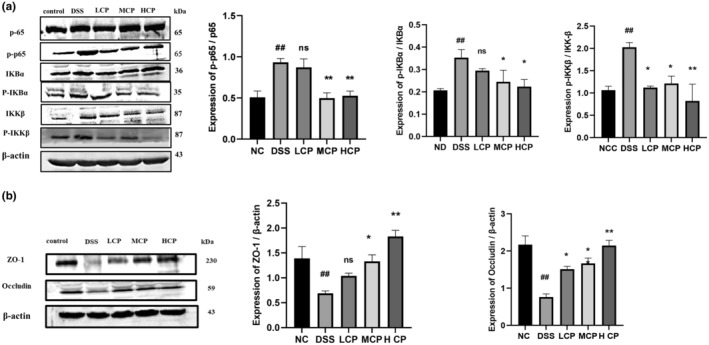
FIGURE 11.

Differential modulation of colitis‐associated pathway and tight junction expression by CPH treatment. (a) Western blot images showing the expression of proteins p65, p‐p65, p‐IκB‐α, p‐IκB‐α, IKK‐β, and p‐IKK‐β. (b) The relative expression levels of tight junction proteins ZO‐1 and Occludin in colonic tissue, with β‐actin as a loading sample. Comparison to normal control ## p < .01, comparison to DSS group; *p < .05, **p < .01, ns, non‐significant.
