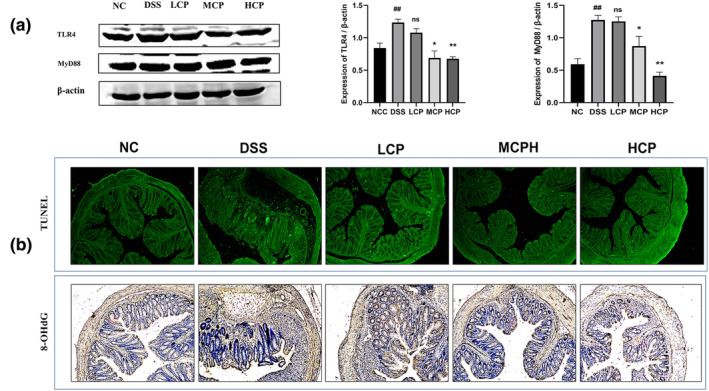
FIGURE 12.

(a) Western blot images showing the relative expression of TLR4 and MyD88. β‐Actin served as the internal control. Bar graph representing the relative expression of each protein analyzed by ImageJ. Data reflected as ±SEM ### p < .01 versus normal control, versus DSS *p < .05, **p < .01, and ns, non‐significant. (b) Sea conch peptide hydrolysate (CPH) reduces oxidative stress and cell apoptosis. TUNEL assay (green, fluorescent assay) and immunohistochemical staining for 8‐OHG of colon section; the picture shows the histological features (magnification 10×).
