FIGURE 3.

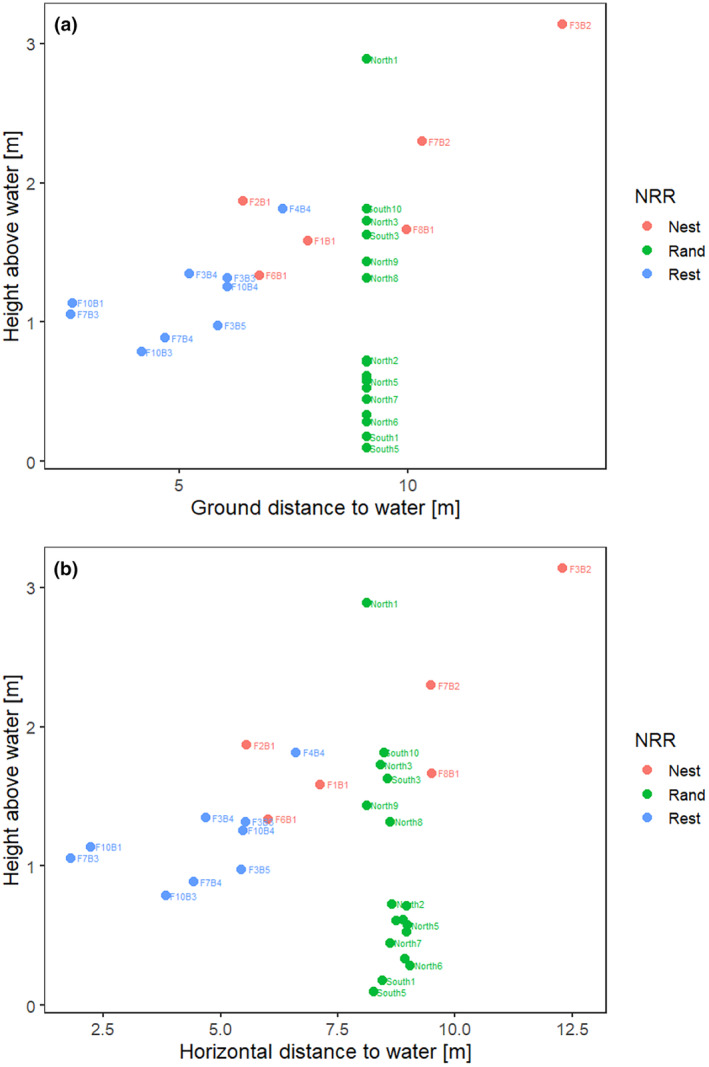
Scatter plots between (a) burrow height and distance to water along the ground and (b) burrow height and horizontal distance to water (nesting burrow = red, resting burrow = blue, random = green).

Scatter plots between (a) burrow height and distance to water along the ground and (b) burrow height and horizontal distance to water (nesting burrow = red, resting burrow = blue, random = green).