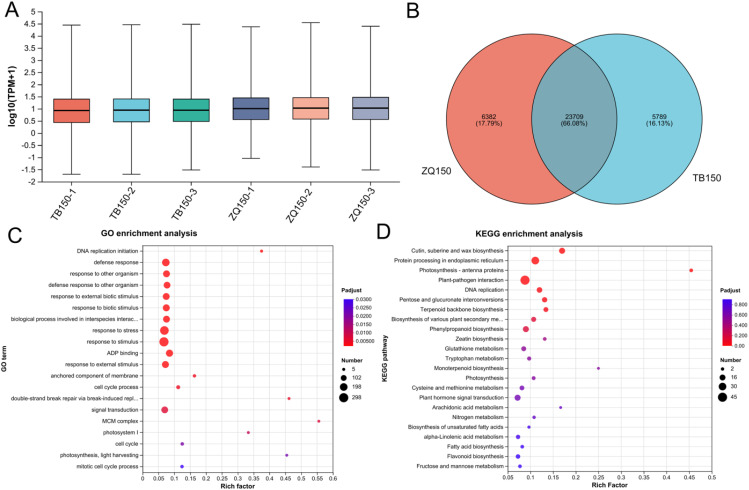
Figure 2.
The boxplot showed the unigene expression distribution of each sample (A). Venn analysis represents the number of shared and unique unigenes among both samples (B). Gene classification was based on Gene Ontology (GO) (C) and Kyoto Encyclopedia of Genes and Genomes (KEGG) analysis for DEGs (D). The GO term and KEGG pathway names are provided on the vertical axis. The horizontal axis represents the Rich factor (the ratio of the number of unigenes enriched in the GO term and KEGG pathways to the number of annotated genes). The larger the rich factor, the greater the degree of enrichment. The size of the dot represents the number of genes, and the color of the dot corresponds to different false discovery rate (FDR) (Pvaule_corrected) ranges.

