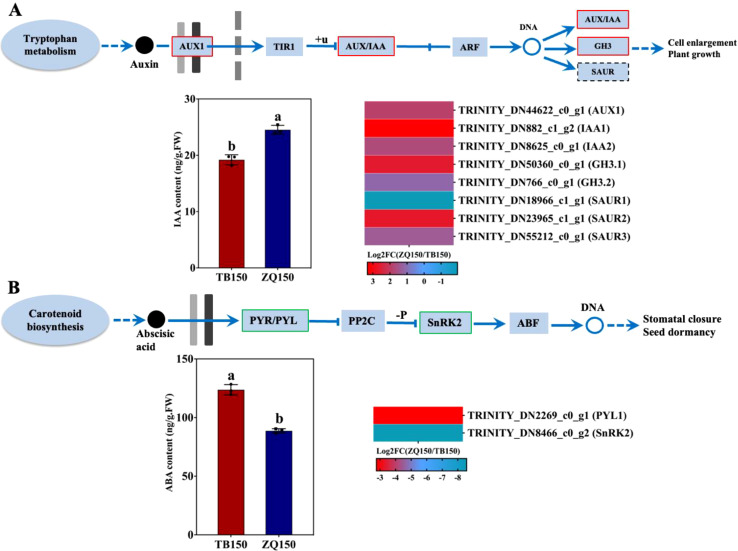
Figure 5.
Measurement of the endogenous content of indole-3-acetic acid (IAA) and selected differentially expressed genes (DEGs) related to auxin from the RNA sequencing data (A). The concentration of abscisic acid (ABA) and selected DEGs related to ABA (B). Heat map diagram of the log2FC; the color scale represents the expression levels from lower to higher. Error bars refer to the average value ± SD from three biological replications. Different letters above the columns indicate significant differences according to a least significant difference (LSD) test at a 0.05% level.

