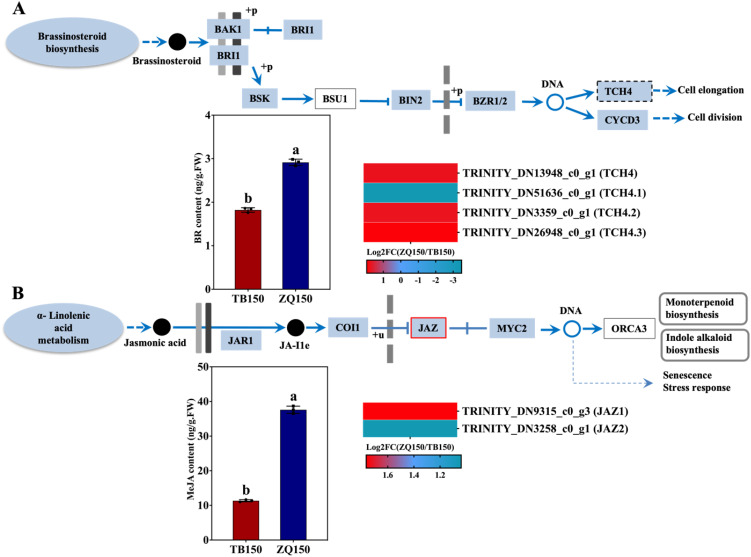
Figure 6.
Measurement of the endogenous content of brassinosteroid (BR) and selected differentially expressed genes (DEGs) related to BR from the RNA-sequencing data (A). The concentration of methyl jasmonate (MeJA) and selected DEGs related to JA (B). Heat map diagram of the log2FC; the color scale represents the expression levels from lower to higher. Error bars refer to the average value ± SD from three biological replications. Different letters above the columns indicate significant differences according to a least significant difference (LSD) test at a 0.05% level.

