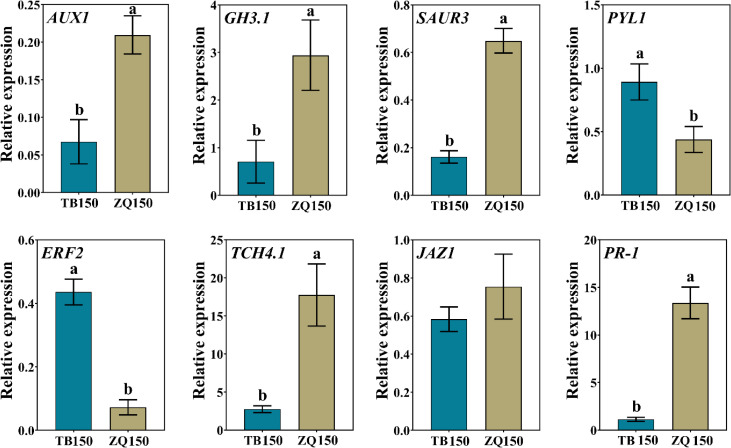
Figure 9.
RT-qPCR–based expression analysis of differentially expressed genes (DEGs) to authenticate the RNA-seq data. Error bars refer to the average value ± SD from three biological replications. Different letters above the columns indicate significant differences according to a least significant difference (LSD) test at a 0.05% level.

