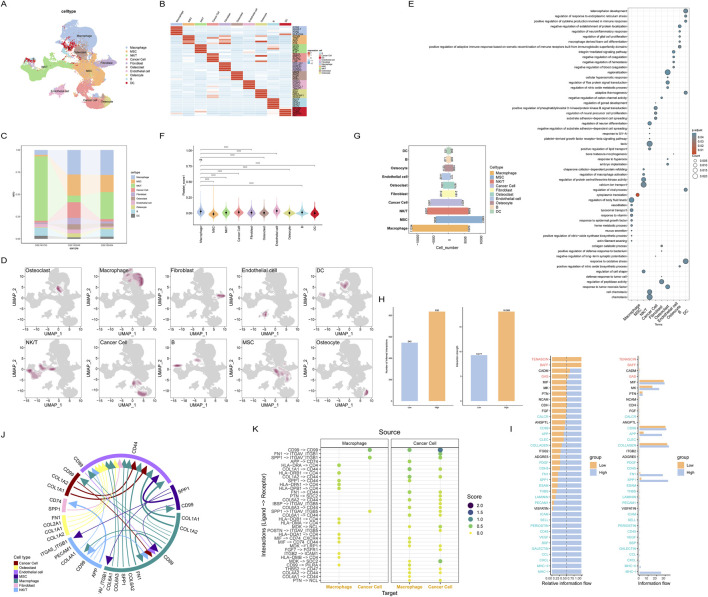
FIGURE 3.
Cell communication between cells with different platelet scores at single-cell resolution; (A) Annotated single-cell transcriptomic data; (B) Marker genes for each cell subset; (C) Distribution of cell types across different datasets; (D) Distribution density of each cell subset; (E) Enriched pathways for each cell subset; (F) Grouping of all cells by platelet score; (G) Cells are categorized based on their platelet scores; (H) Comparison of communication intensity between cells in different platelet score groups; (I) Cell-cell communication pathways between the two groups of cells; (J) Major intercellular communication pathways among all cells; (K) Intercellular communication between macrophages and tumor cells with high platelet scores.

