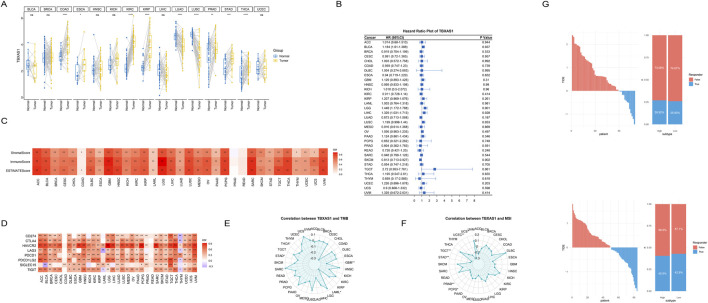
FIGURE 5.
Pan-cancer analysis of the TBXAS1 gene. (A) TBXAS1 is significantly differentially highly expressed in various tumors; (B) COX regression analysis of TBXAS1 in various tumors; (C) Heatmap of the correlation between immune scores of various tumors and TBXAS1 expression; (D) Heatmap of the correlation between the expression of immune checkpoints in various tumors and TBXAS1 expression; (E) Heatmap of the correlation between TMB (Tumor Mutational Burden) in various tumors and TBXAS1 expression; (F) Heatmap of the correlation between MSI (Microsatellite Instability) in various tumors and TBXAS1 expression; (G) Relationship between platelet score obtained from TIDE website analysis and immunotherapy response; Top: GSE21257 dataset; Bottom: TARGET-OS dataset.

