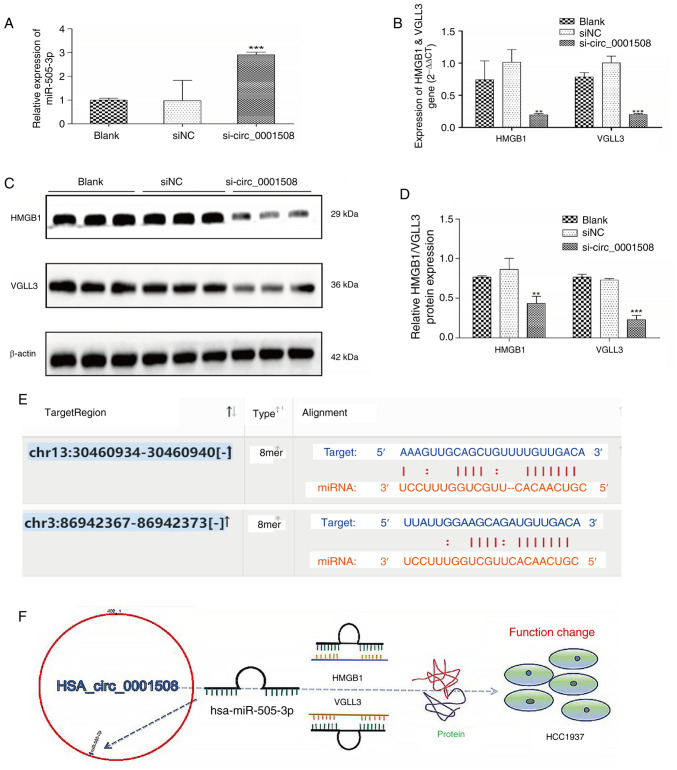
Figure 3.
Expression of miR-505-3p and protein HMGB1 and VGLL3 in HCC1937 cells after hsa_circ_0001508 knockdown. (A) Expression of miR-505-3p was the highest in si-circ_0001508 group vs. si-NC and blank groups as identified using RT-qPCR. (B) Expression of HMGB1 and VGLL3 was lower in si-circ_0001508 group vs. siNC and blank groups as demonstrated using RT-qPCR. (C and D) Protein expression of HMGB1 and VGLL3 was suppressed in the si-circ_0001508 group vs. si-NC and blank groups as determined using the western blot assay. (E) Binding sites between miR-505-3p and HMGB1 and VGLL3 predicted using the TargetSCAN website. (F) Schematic diagram of hsa_circ_0001508 function in HCC1937 cells. **P<0.01 and ***P<0.001 vs. si-NC and blank groups. miR, microRNA; RT-qPCR, reverse transcription-quantitative PCR; si-circ_0001508, small interfering RNA of circ_0001508; si-NC, small-interfering RNA negative control.

