Figure 1.
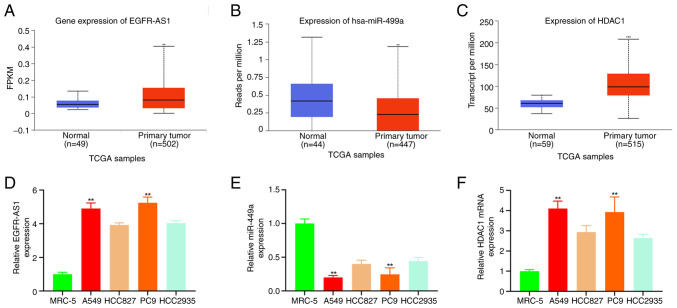
TCGA and qPCR were employed to measure EGFR-AS1, miR-449a and HDAC1 in NSCLC. (A) UALCAN test for NSCLC (EGFR-AS1) in NSCLC and adjacent tissues in TCGA samples. **P<0.01 compared with adjacent tissues. (B) UALCAN test for miR-449a was expressed in NSCLC and adjacent tissues in TCGA samples. **P<0.01 compared with normal adjacent tissues. (C) UALCAN analysis of HDAC1 expression in NSCLC cancer and adjacent tissues of TCGA data. ***P<0.01 compared with normal adjacent tissues. Quantification of (D) EGFR-AS1 expression (E) miR-449a expression and (F) HDAC1 expression in MRC-5 and NSCLC with qPCR. **P<0.01. TCGA, The Cancer Genome Atlas; qPCR, quantitative PCR; HDAC1, histone deacetylase 1; University of Alabama at Birmingham cancer data analysis portal; NSCLC, non-small-cell lung cancer; miR, microRNA.

