. 2024 Dec 20;12(6):e004454. doi: 10.1136/bmjdrc-2024-004454

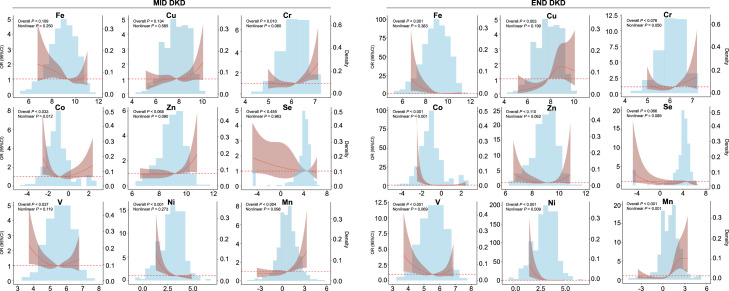
Figure 1. Restricted cubic spline analysis of the risk association between DKD at different stages and urinary element concentrations. Restricted cubic spline plots from logistic regression models showing adjusted HRs and 95% CIs in elements concentration for DKD stages. Straight bars are used to show the distribution of each element in different DKD stages. The outliers of the mean ±3 SD are removed when the histogram is drawn. All models were adjusted by sex, BMI, age, smoking status, education, occupation, diabetes-specific complications, cardiovascular diseases, and other systemic diseases. BMI, body mass index; Cu, copper; Co, cobalt; Cr, chromium; DKD, diabetic kidney disease; Fe, iron; Mn, manganese; Ni, nickel; Se, selenium; V, vanadium; Zn, zinc.

Figure 1