
FIGURE 5.
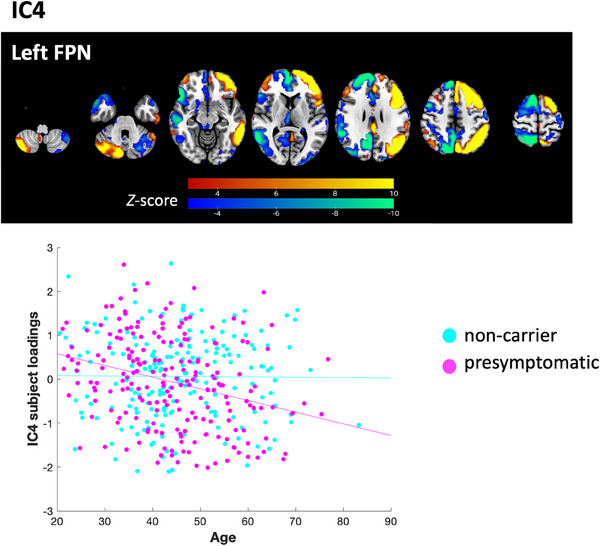
Brain visualization of linked independent component analysis component 4 (IC4), showing the left frontoparietal network (FPN). For visualization, the brain spatial map threshold is set to 3 < |Z| < 10. The scatter plot shows the correlation between age and IC4 subject loadings, separated by pre‐symptomatic genetic mutation carriers (r = −0.30, p < 0.001) and non‐carriers (r = −0.0087, p = 0.91).