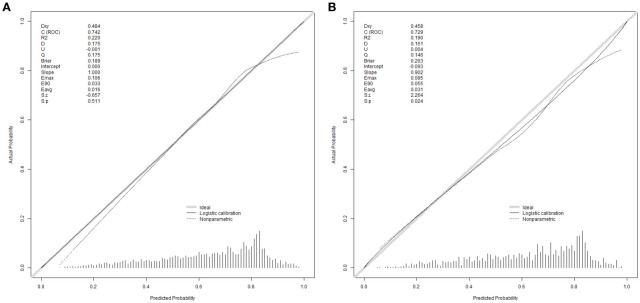
Figure 3.
Calibration curves were used to evaluate the calibration of the model. The horizontal axis is the predicted probability provided by this model, and the vertical axis is the observed incidence of blastocyst formation. The ideal line with 45° slope represents a perfect prediction (the predicted probability equals the observed probability). The lower the Brier score for a set of predictions, the better the prediction calibration. When the slope was closer to 1.00, the prediction model had better calibration power. (A) Calibration curve for training set (Brier = 0.189, Slope = 1.000). (B) Calibration curve for validation set (Brier = 0.203, Slope = 0.902).

