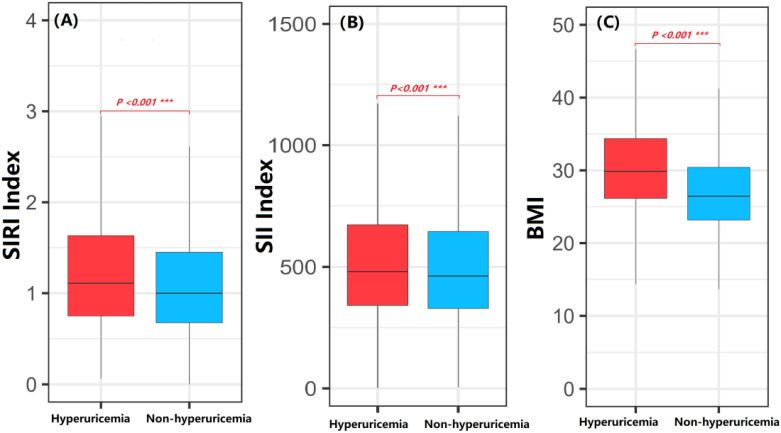
Figure 1.
Comparison of SIRI index, SII index and BMI between hyperuricemia and non-hyperuricemia participants. Student t-tests and Mann-Whitney U tests were employed to compare the differences in SIRI index, SII index and BMI between the non-hyperuricemia and hyperuricemia groups. (A) SIRI index; (B) SII index; (C) BMI; The P value represents the statistical significance for testing the difference between hyperuricemia and non-hyperuricemia participants. ***P-value < 0.001.

