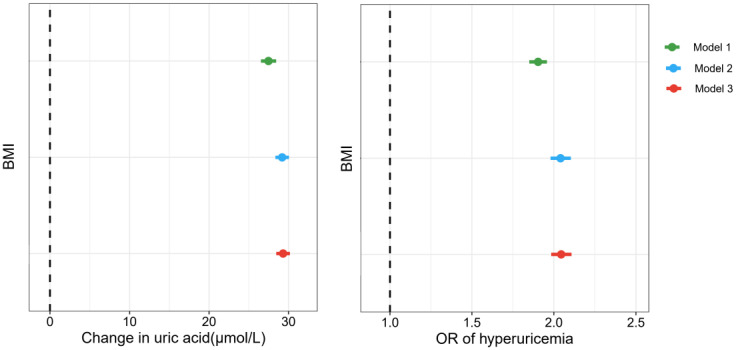
Figure 4.
Associations of BMI with uric acid concentration and hyperuricemia risk. Model 1, unadjusted for covariates; Model 2, adjusted for age, sex, race, marital status, and education level; Model 3, adjusted for age, sex, race, marital status, education level, smoking status, alcohol consumption, and intake of fish and shellfish.

