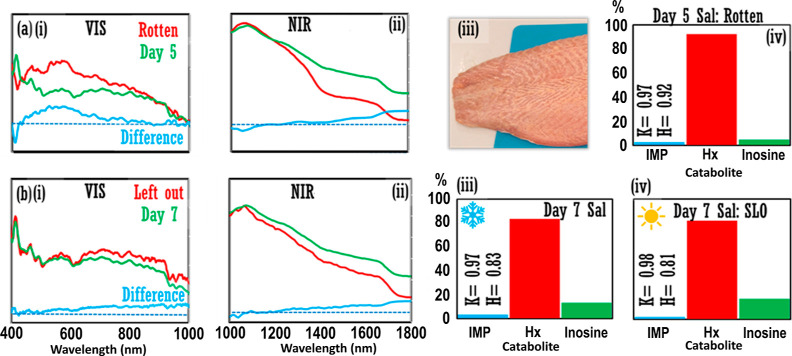
Figure 3.
Additional experiments. (a) Comparison of Day5 salmon from Phase 1 experiment (“Fillet 1”, green line) and rotten salmon fillet (“Fillet 0”, red line) across (i) visible and (ii) NIR ranges. (iii) Photograph of rotten salmon fillet. Catabolite relative percentages performed on rotten salmon fillet, Fillet 0, on Day5. Catabolite data for Day5 salmon fillet, Fillet 1, are in Figure 2b(iii). (b) Comparison of Day7 salmon fillet, Fillet 1, which was refrigerated at 4 °C/39 °F when not being analyzed as normal (green line), and a cut of Fillet 1 that had been left out on the benchtop in the temperature-controlled laboratory for ca. 30 h previous, for (i) visible and (ii) NIR ranges. Catabolite relative percentages for Day7 salmon fillet (iii) refrigerated, and (iv) left out on lab bench (“SLO”). Inset: K-value and H-value. [b(iii)] is replotted from Figure 2b(iv) for easy comparison with SLO catabolite percentages in [b(iv)]. Light blue lines in [a(i,ii)] and [b(i,ii)] represent difference spectra; blue dash = unity position (color in print/online).

