Figure 4.
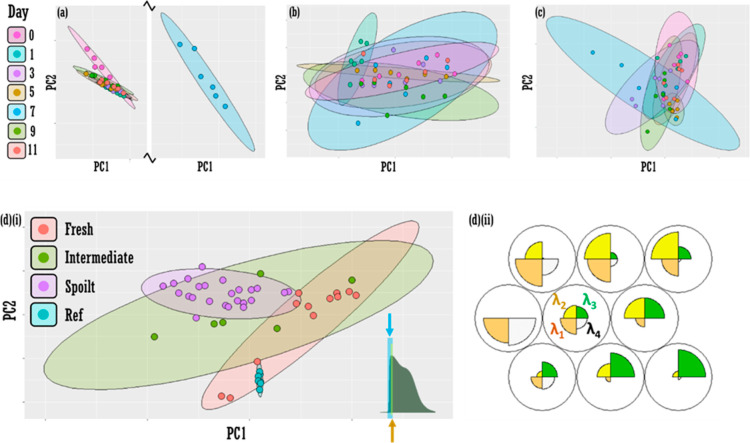
Feature selection as a method to improve fresh vs spoilt classification accuracy in fluorescence data. PCA (PC1 vs PC2) for (a) visible (b) NIR and (c) fluorescence data as a function of day. Confidence ellipses at 95%. [d(i)] Pooled data PCA plot (PC1 vs PC2) with feature selection showing discrimination between “fresh” (Days 0 and 1, orange ellipse) and “spoilt” (Days 5, 7, 9, and 11, purple ellipse). Day3 classes at “intermediate” (green ellipse). Nonpooled data PCA plot in the Supporting Information Section Figure S4. Features selected are wavelengths: 453, 455, 457, and 459 nm (to nearest integer value). Confidence ellipses set at 95%. Inset: yellow bar indicates approximate range of variables selected for truncated data set in [d(i)]. Expanded blue bar represents extended 13-variable model (435–459 nm), which provides poorer pooled class discrimination (see Supporting Information Section Figure S9). [d(ii)] Self-organizing maps “codes plot” displaying the map of the importance of each of the four variables (wavelengths: λ1–4 i.e., 453, 455, 457, and 459 nm) across all spectral data (color in print/online).

