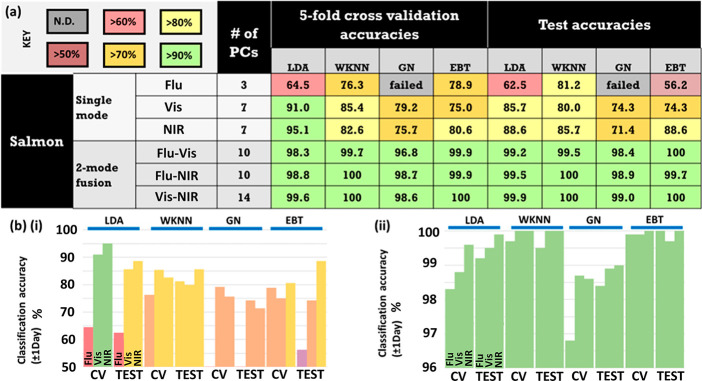
Figure 5.
Phase 2 single-mode and dual-mode classification. (a) Salmon fillet classification accuracies ±1 day for 5-fold cross validation and test data sets for single-mode and dual-mode fusion for fluorescence (Flu), visible absorbance (vis), and NIR absorbance (NIR) phenomena, for four different classification algorithms: LDA, WKNN, Gaussian naïve (GN), and EBT. Accuracies color-coded: green: 90–100%; yellow: 80–89%; orange: 70–79%; red: 60–70%; brown 50–60%; and gray: no classification. “# of PCs” refers to the number of PCs retained for each classification model. An optimal number of PCs were selected for each model. Data were acquired from a second salmon fillet/set of experiments (Fillet 2, Phase 2). Data graphed in (b) for (i) single-mode and (ii) dual-mode. CV and test data are plotted for each algorithm (color in print/online).

