FIGURE 3.

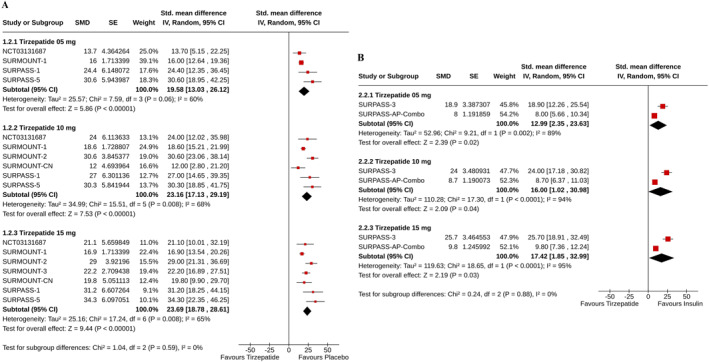
Forest plot highlighting the percent changes from baseline in pancreatic amylase: (A) tirzepatide versus Placebo, (B) tirzepatide versus insulin.

Forest plot highlighting the percent changes from baseline in pancreatic amylase: (A) tirzepatide versus Placebo, (B) tirzepatide versus insulin.