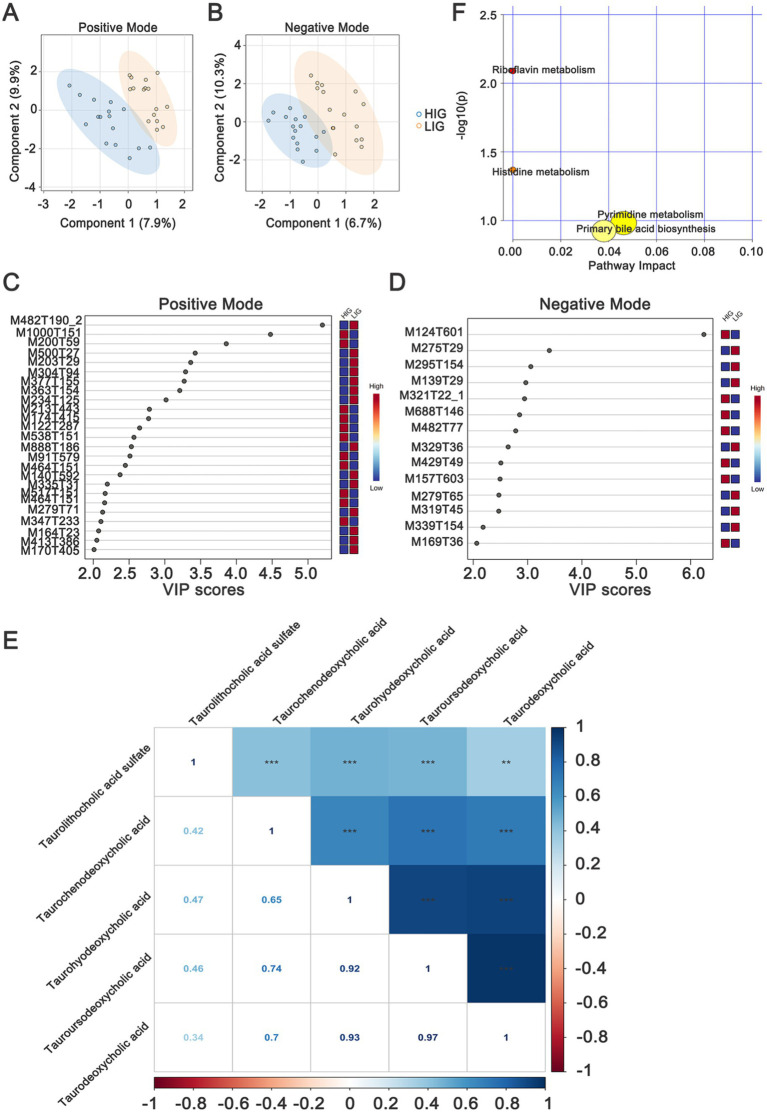
Figure 5.
Identifying serum metabolites and metabolic pathways that differ between HIG (n = 16) and LIG (n = 16) chickens. OPLS-DA analysis of serum metabolomics profiles showed a clear separation between HIG and LIG chickens both in (A) positive and (B) negative ion modes. Variable importance in projection (VIP >2) scores for the top serum metabolites in (C) positive and (D) negative modes contributing to variation in metabolic profiles of HIG and LIG chickens. The relative abundance of metabolites is indicated by a colored scale from blue to red representing the low and high, respectively. (E) The correlation of five bile acids which are related with IMF. (F) Pathway enrichment analysis of metabolites associated with IMF in chickens. OPLS-DA, orthogonal partial least squares-discriminant analysis; HIG, chickens with high intramuscular fat content; LIG, chickens with low intramuscular fat content. The metabolites are shown in Table 3.

