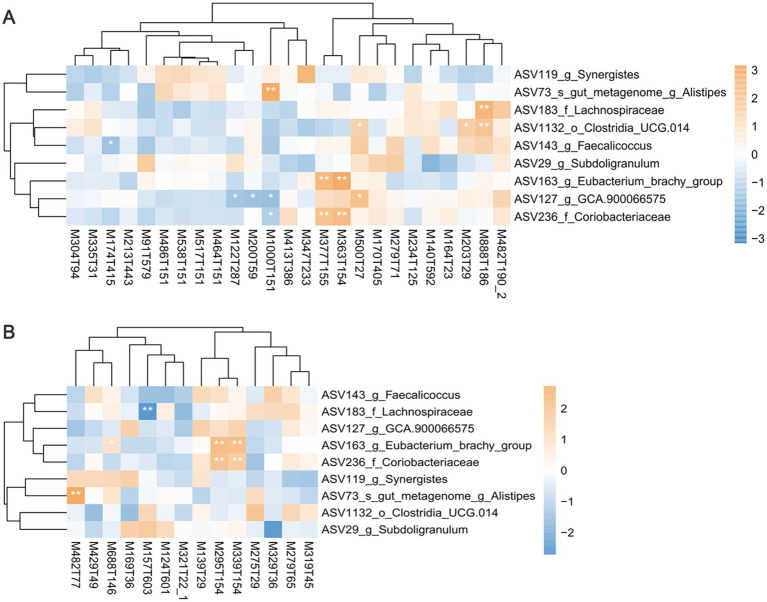
Figure 6.
The correlation analysis between differential bacteria and differential serum metabolites. Heatmaps showing the correlations between differential bacteria and differential serum metabolites in (A) positive mode and (B) negative mode. Positive correlations are displayed in brown and negative correlations in blue. *p < 0.05, **p < 0.01, and ***p < 0.001.

