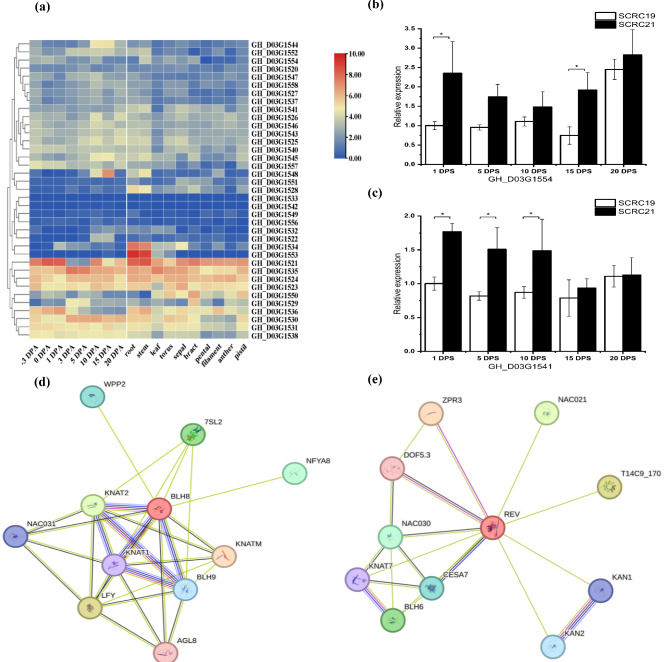
Fig. 5.
Gene expression and protein interaction prediction of genes in QTL cluster on Dt3. (a) The expression of genes from QTL cluster on Dt3. (b) Relative expression of GH_D03G1554 at different stages of flower bud; (c) Relative expression of GH_D03G1541 at different stages of flower bud. 1 DPS, 5 DPS, 10 DPS, 15 DPS and 20 DPS indicate 1, 5, 10, 15 and 20 days post flower bud, respectively. * Indicates significant difference (Diff.) at p = 0.05. The error bars indicate the standard deviation of three biological replicates. (d) Protein interaction prediction of GH_D03G1554; (e) Protein interaction prediction of GH_D03G1541

