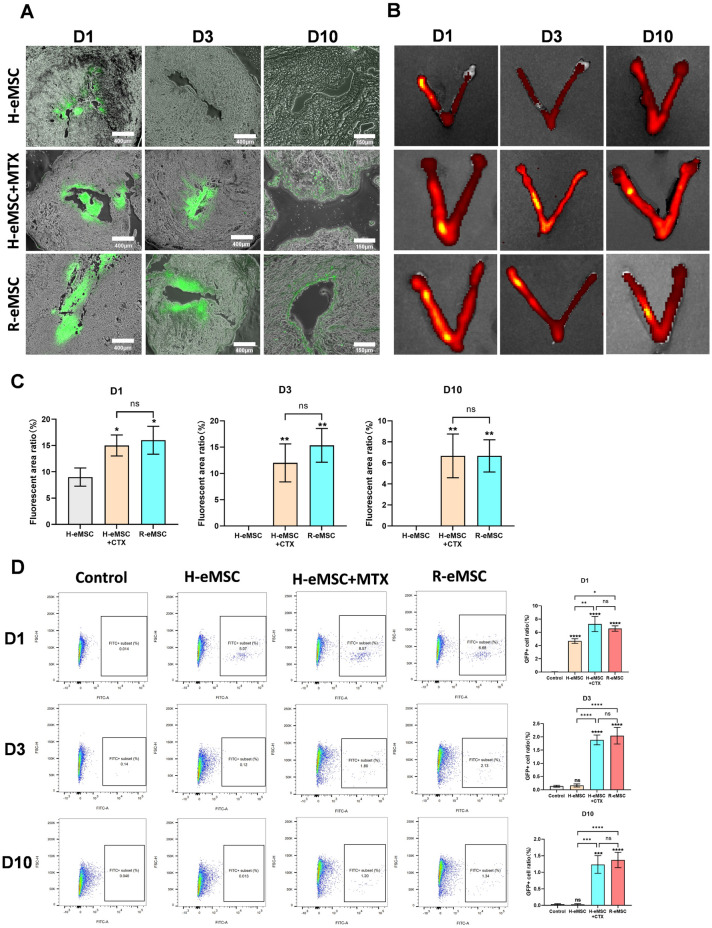
Fig. 3.
Evaluation of H-eMSC and R-eMSC adhesion after in vivo transplantation. (A) Frozen section was used to evaluate the retention time of GFP-labeled cells 1, 3, and 10 days after transplantation of H-eMSC, H-eMSC + MTX, and R-eMSC. (D1 and D3 Scale bar: 400 μm, D10 Scale bar: 170 μm). (B) In vivo image was used to evaluate the retention time of GFP-labeled cells 1, 3, and 10 days after transplantation of H-eMSC, H-eMSC + MTX, and R-eMSC. (C) Percentage of GFP immunofluorescence positive areas. (D) Flow cytometry was used to evaluate the retention time of GFP-labeled cells 1, 3, and 10 days after transplantation of H-eMSC, H-eMSC + MTX, R-eMSC. (Mean ± SD, n = 3, *P < 0.05, **P < 0.01, ***P < 0.001, and ****P < 0.0001)

