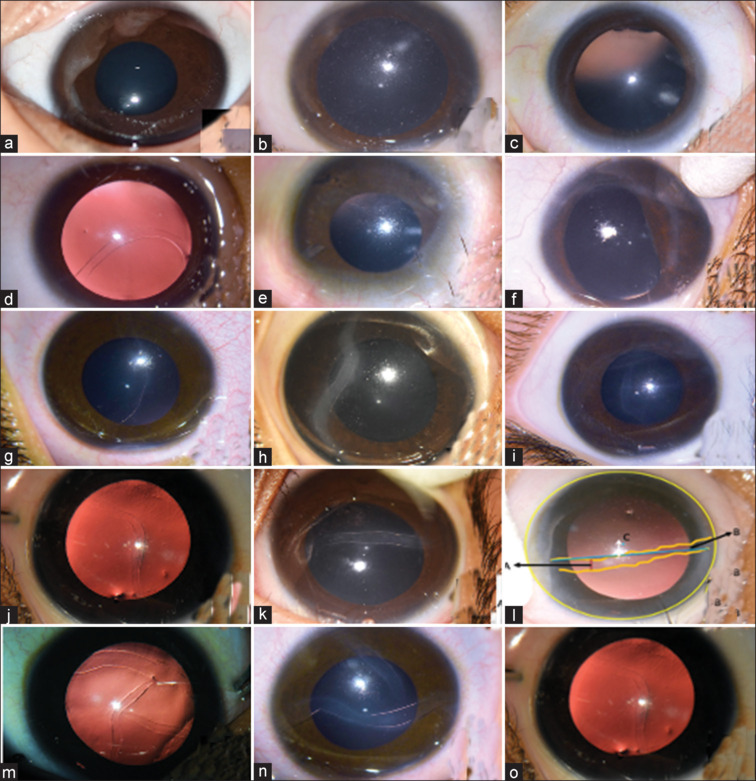
Figure 1.

Shows different types of HS seen in our cohort. (a–c) Shows circumferential, (d–f) shows horseshoe, (g–i) shows vertical, (j) shows oblique, (k and l) shows the horizontal pattern and (m–o) shows combinations of HS patterns. (l) Shows markings of parameters: A = Width of Haab's Striae, B = Arc Length of Haab's Striae, C = Corneal center to HS distance, HS = Haab's Striae
