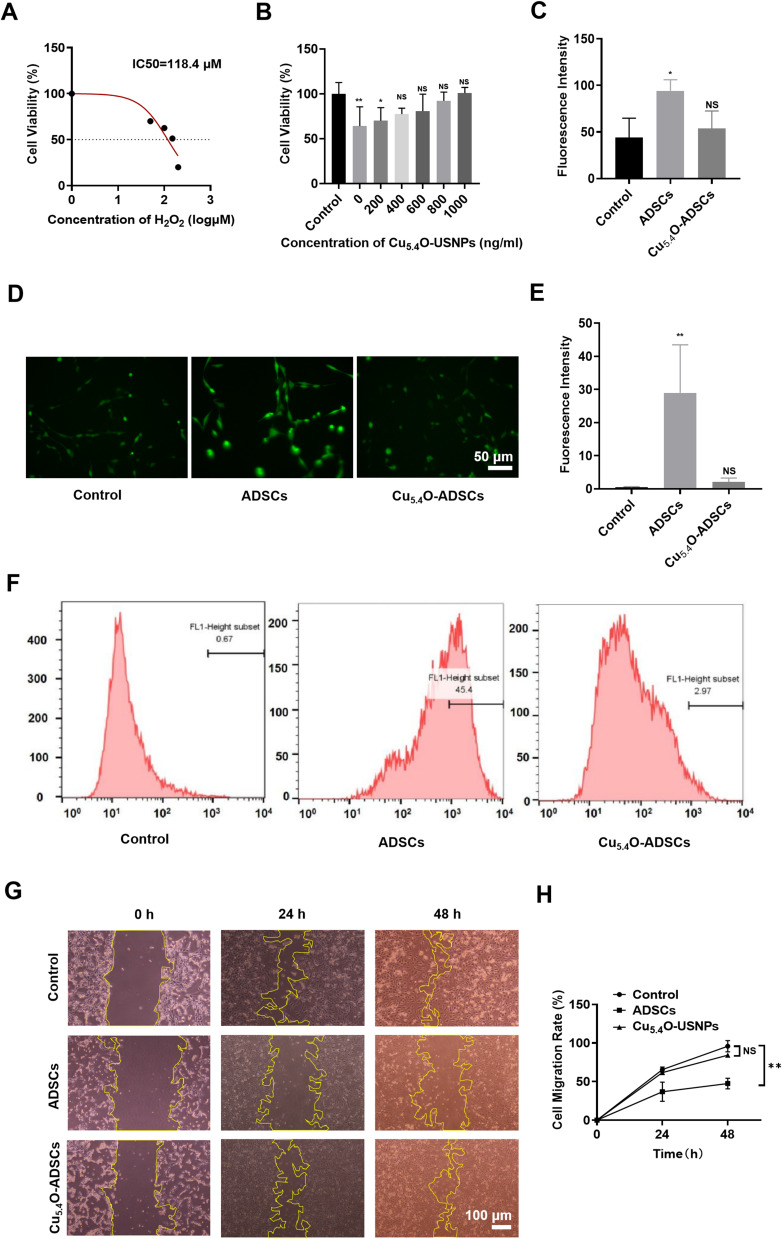
Figure 2.
(A) Cell viability and IC50 of ADSCs after 24 hours of stimulation with 0–200 μM H2O2. (B) Cell viability of Cu5.4O-ADSCs at different concentrations after 24 hours of stimulation with 100 μM H2O2. (C and D) Microscopic scratch images of different treatment groups at three time points: 0h, 24h, and 48h. (E) Representative images of different treatment groups after DCFH-DA staining under a fluorescence microscope. (F) Intracellular ROS content of different treatment groups obtained by flow cytometry. (G) Average fluorescence intensity of different groups under a fluorescence microscope. (H) Relative fluorescence intensity of different treatment groups obtained from flow cytometry results. *P<0.05,** P<0.01, NS P>0.05.

