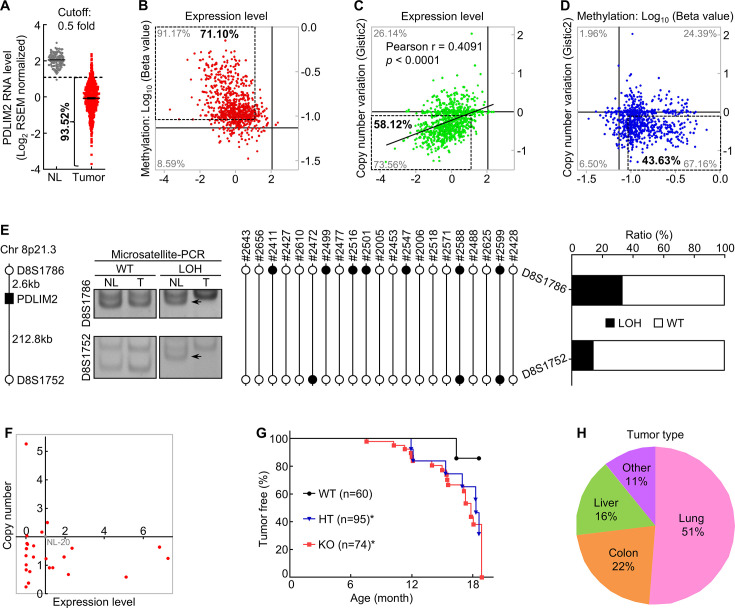
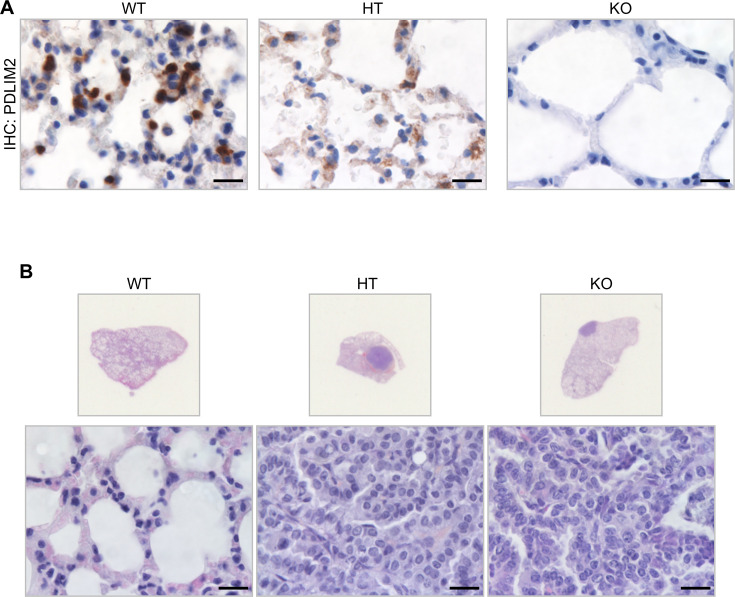
Figure 1. PDLIM2 repression in human lung cancer involves both epigenetic alteration and genetic deletion, and Pdlim2 genetic deletion in mice leads to development of spontaneous tumors, majorly lung tumors.
(A) TCGA data showing PDLIM2 repression in over 90% of lung tumors if using 50% of the expression level in normal lung tissues as the cut-off (NL, n=110; Tumor, n=1019). (B) TCGA data showing PDLIM2 promoter hypermethylation and expression repression (dashed box) in over 70% of lung tumors when using 125% of the methylation level in normal lung tissues as the cut-off (n=827). (C) TCGA data showing positive associations between PDLIM2 expression and its gene copy numbers as well as PDLIM2 genetic deletion and expression repression (dashed box) in about 58% of lung tumors using the copy number variation of –0.1 as the cut-off (n=1010). (D) TCGA data showing simultaneous promoter hypermethylation and genomic deletion of PDLIM2 (dashed box) in about 44% of lung tumors (n=816). (E) Microsatellite-PCR showing PDLIM2 loss in human lung tumors (n=21). (F) qPCR showing PDLIM2 loss in human lung cancer cell lines with known copy number of the PDLIM2 gene (n=25). (G) Kaplan-Meier tumor-free survival curve showing increased spontaneous tumors in Pdlim2-/- and Pdlim2+/- mice compared to WT mice. Gehan-Breslow-Wilcoxon test was performed. *<0.05. (H) Percentage of tumor types spontaneously developed in Pdlim2-/- and Pdlim2+/- mice showing a majority of lung tumors.


