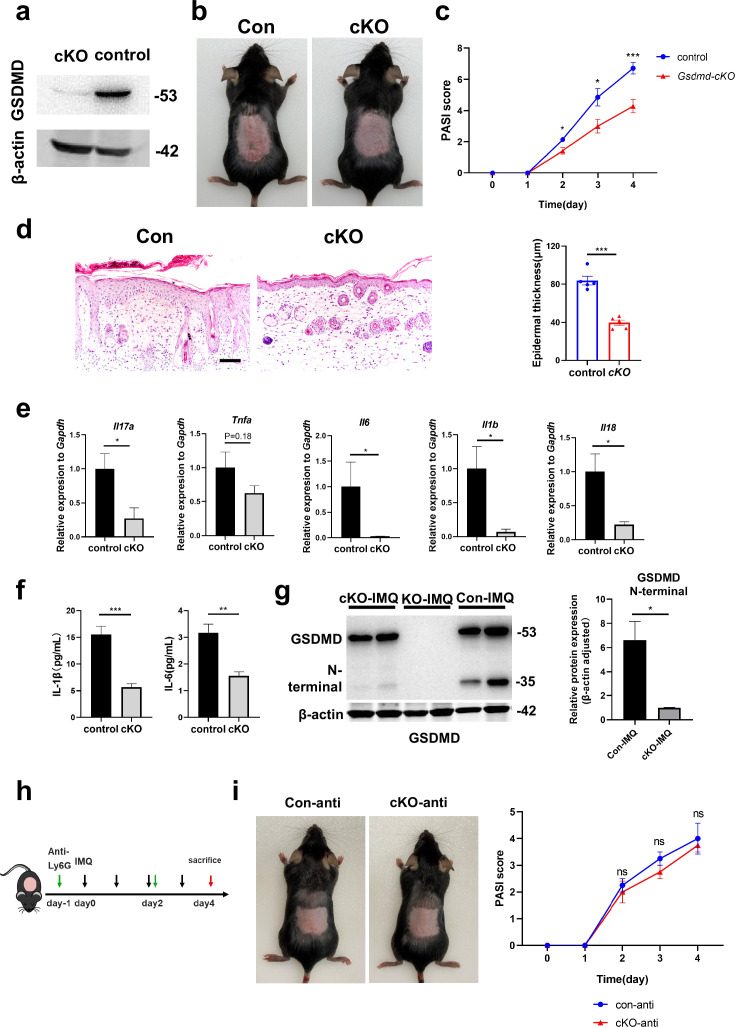
Figure 4. GSDMD depletion in neutrophils attenuates the development of skin inflammation in psoriasis.
(a) Representative images of western blot showing the expression of GSDMD in bone marrow-derived neutrophils of cKO and isotype control mice. (b) Macroscopic phenotypic representation of the dorsal skin in control and GSDMD-cKO mice treated with IMQ at day 4. (c) Disease severity of psoriasis induced by IMQ in mice as assessed by PASI score (n=7). (d) Representative images and statistical analysis of hematoxylin and eosin staining of the dorsal skin in control and GSDMD-cKO mice treated with IMQ at day 4 (n=5). Scale bar = 100 µm. (e) Quantitative PCR analysis of the relative mRNA expression of proinflammatory cytokines in the dorsal skin of control and GSDMD-cKO mice treated with IMQ at day 4 (n=4). Data were normalized to a reference gene, GAPDH. (f) ELISA analysis of IL-6 and IL-1β per 1 mg of the dorsal skin from control and GSDMD-cKO mice treated with IMQ at day 4 (n=5). (g) Representative images and statistical analysis of western blot analysis showing the expression level of GSDMD and its N-terminal fragments in dorsal skin of WT, cKO, and Gsdmd-/- mice treated with IMQ at day 4 (n=4). (h) Schematic representation of the use of anti-Ly6G antibody in the IMQ-induced psoriasis mouse model. (i) Macroscopic phenotypic representation and PASI score of cKO mice and control mice treated with IMQ and Ly6G antibody. cKO, conditional knockout; ELISA, enzyme-linked immunosorbent assay; IMQ, imiquimod; PASI, psoriasis area and severity index, WT, wild-type. Error bars show mean ± SEM. *p<0.05, **p<0.01, ***p<0.001. Data are representative of three independent experiments for (a, b, d, g, i).


