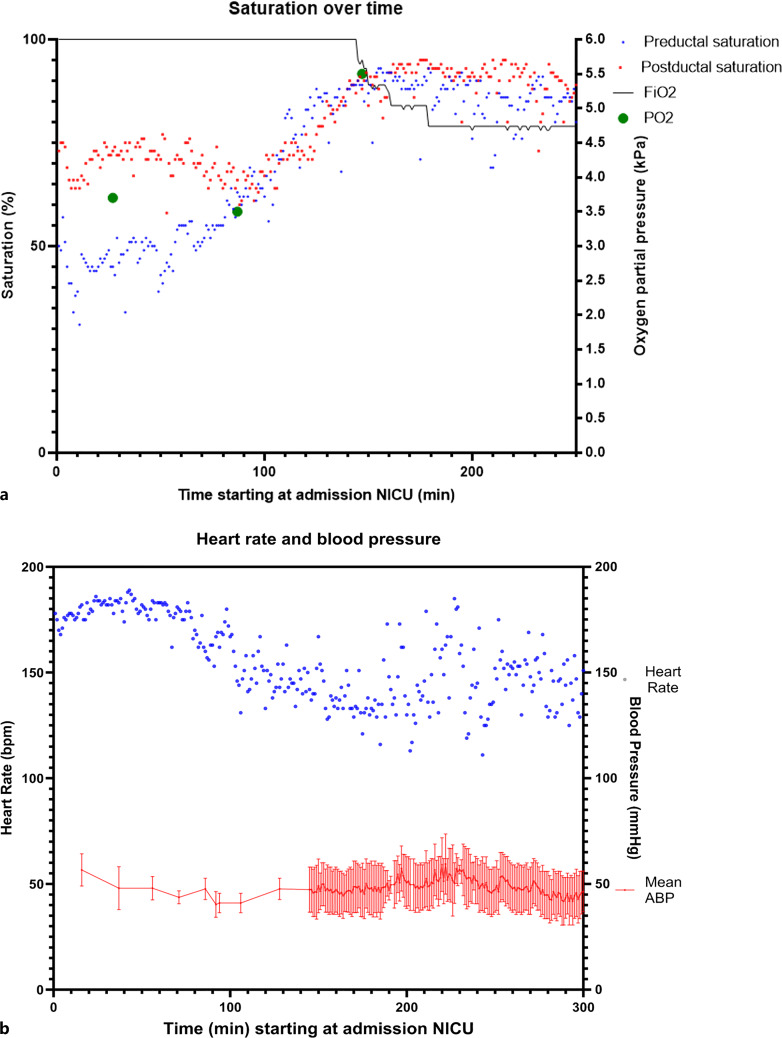
Fig. 1.
Trend of hemodynamic parameters and pulse oxygen saturation over time. Changes of saturation (a), heart rate (b) and arterial blood pressure (b) over time (in minutes), starting at NICU admission (±30 min post birth). a Blue dots indicate the preductal saturation and the red dots the post-ductal saturation measurements. b Blue dots indicate heart rate trend and the red line the mean arterial blood pressure (ABP), including systolic and diastolic blood pressure (interval). BP, blood pressure; FiO2, fraction of inspired oxygen; min, minutes; NICU, neonatal intensive care unit; PO2, partial pressure of oxygen.

