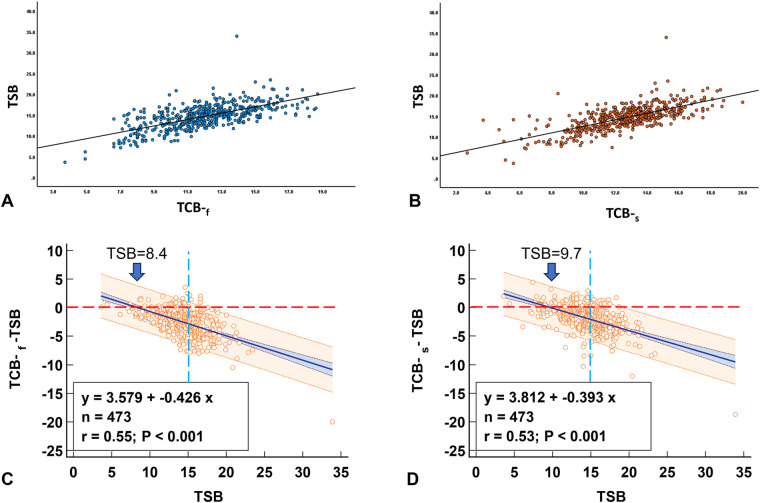
Figure 5.
The relationship between TSB and concurrent TCB. When the TSB value is close to the treatment threshold, TCB underestimates the jaundice level. (A) Correlation between TSB and TCB-f. (B) Correlation between TSB and TCB-s. (C) TCB-f readings start to underestimate the jaundice level at TSB of 8.4. (D) TCB-s readings begin to underestimate the jaundice level at TSB of 9.7. Red dash line: identity line; Blue dash line: TSB of 15.0.

