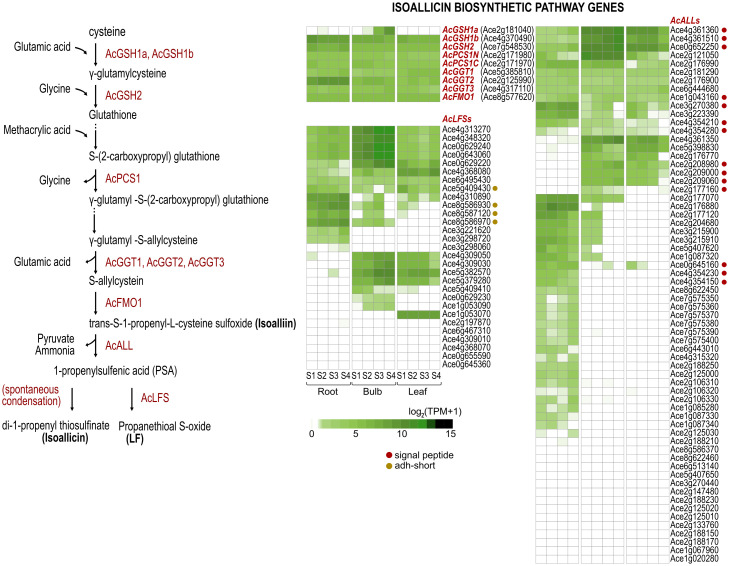
Figure 2.
A simplified representation of the isoallicin biosynthetic pathway of onion and transcription profiles of the corresponding enzyme-encoding genes according to tissues and bulb growing stages (S1, S2, S3 and S4) of DHW30006 onion plants. The enzymes of each catalytic step are shown in red. Dots indicate the signal peptide (red) and the adh_short motif (dark yellow).

