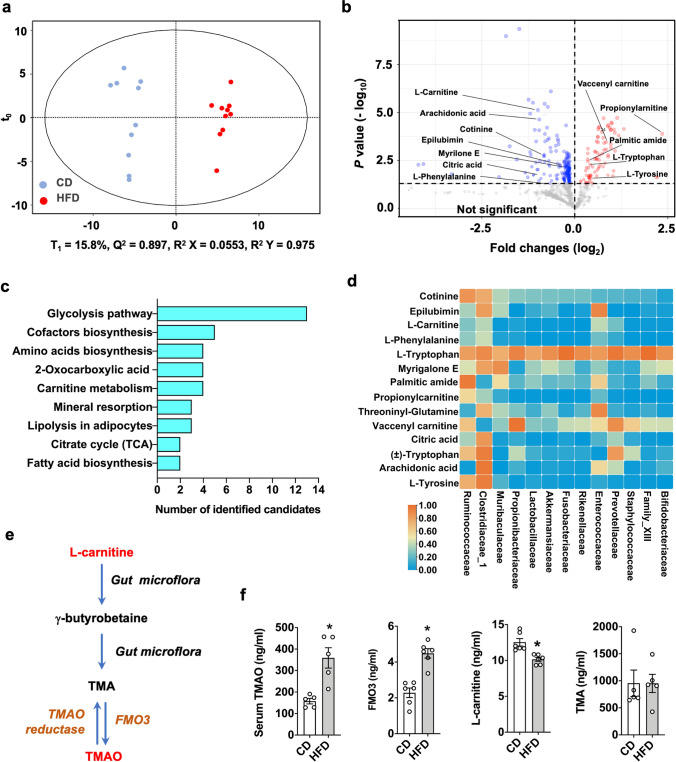
Fig. 3.
Altered serum metabolomic landscape in obese mice. Principal component analysis showing distinctive metabolomic profiles (a). Volcanic plot showing 85 and 187 metabolites elevated or reduced, respectively, in obese mice (b). KEGG pathway of metabolomic landscapes, which may contribute to plenty of cellular metabolism (c). Heatmap showing the correlation of serum metabolites and gut microorganisms (d). A drawing scheme depicting L-carnitine conversion into TMA and TMAO by gut microorganisms and FMO3 (e). Increased serum TMAO and FMO3 together with reduced L-carnitine levels in obese mice. Data are calculated from 5 mice. Asterisks (*) stand for significant difference (P < 0.05) analyzed by Kolmogorov–Smirnov test and Student t-test

