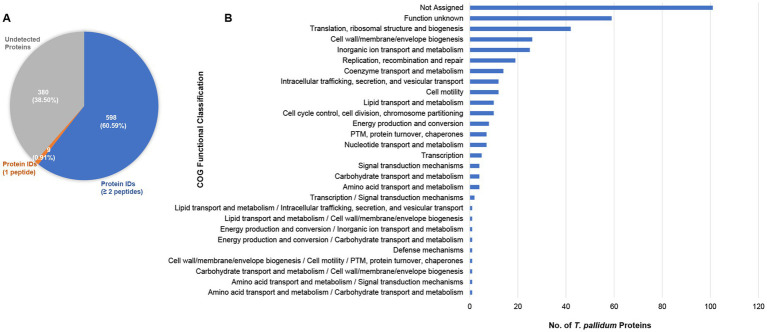
Figure 1.
Proteome coverage of T. pallidum SS14. (A) Pie chart showing the total number of SS14 proteins detected in the present study based on the detection of a single peptide, or at least two peptides. The number of undetected T. pallidum proteins is also shown. Values in parentheses indicate the percentage of T. pallidum proteins found in each of the three categories. (B) Bar chart showing the COG (Clusters of Orthologous Genes) functional classification distribution of 380 T. pallidum proteins that were not detected in the present global proteomics study. COG functional classifications were generated by the eggNOG-mapper tool. Not assigned – proteins where eggNOG-mapper was unable to assign functional classifications. PTM: Post-translational modification.

